- Welcome
-
-
What is a sensor ? -
A use case -
Sensor states: warnings and errors -
Show the sensorboard -
Recieve an email on calamities -
Running the board -
Feature overview
-
- Sensor settings
-
-
Group settings -
Sensor settings -
Subscribers -
Schedules for groups -
Upload and download
-
- Technical matters
-
-
The framework -
Steps: add a sensor -
Parameters and sensor text settings -
The zone -
Internationalization -
oData sensor services -
Advanced topics
-
|
|
Welcome to the manual for
The Sensorboard
You've found the manual for the Sensorboard - home of sensors that keep an eye on details of your S/4 Hana system. The manual consists of 3 main subjects:
- Introduction to the setup. What is the sensorboard, what are sensor types, what are sensors, how can the sensorboard be used.
- The sensor editor - where all customizing for a sensor is done.
- The technical matters - with a step-by-step guide to adding custom sensor types.
The board comes with a suite of operational sensors, which are explained in Sensorboard - sensors manual.
So where did you first hear about the problem ?
That's right,The first signs came from the sensorboard.
Which does exactly what is was designed to do.
Only minutes after it happened.
Welkom op het Sensorbord
Je hebt de handleiding gevonden bij een Nederlands- en Engelstalig sensor bord, thuishaven voor sensoren die een oogje in het zeil voor je houden voor het S/4 Hana systeem. De handleiding is alleen in het Engels beschikbaar en dekt in hoofdlijnen de volgende onderdelen:
- De introductie: wat is een sensor type, wat is een sensor, hoe kan het gebruikt worden en wat kun je allemaal met een sensor (bord).
- De instellingen applicatie voor sensor instellingen.
- De techniek - met een stap-voor-stap gids voor het maken van een nieuw sensor type.
Het sensor bord is uitgerust met een set operationele sensoren die zijn beschreven in de volgende handleiding Sensorboard - sensors manual.
The Sensorboard is a product that was designed and developed in Abap on S/4 Hana. The actual board is shown
in a SAPGUI screen as HTML (CSS, JavaScript) document. The board refreshes automatically to continuously show the
latest available detail. The detail is presented as a KPI (Key Performance Indicator) number each of which which
is explained in the sensor detail report.
Preview of the sensorboard with errors and warnings
An alternative view, where the sensors are compacted.
Preview of the same sensorboard - compactedThe examples show some of the different settings the end user can select for themselves. All examples show the same sensorboard.
The product comes with a series of over 75 technical sensor types that can be customized to perform many possible sensor tasks. The framework also caters for custom sensors - which can easily be added to the board. These will most likely be sensors for functional checks. How to add a custom build sensor to the board is explained on this manual.
De gehele applicatie is beschikbaar in het Nederlands (en tegelijkertijd in het Engels).
The complete application is available in English (and simultaneously in Dutch).
Documentation is only available in English.
Manual about sensors
This is the manual for the sensorboard and framework.
There's also a manual describing the sensors.
| Executive summary |
A sensor is a mini-report that continuously monitors system health by determining and displaying key performance indicators (KPIs).
Each sensor tests specific technical or functional assumptions - such as detecting failed jobs or data inconsistencies - and provides
detailed, actionable insights when issues arise. Together, sensors form a live "sensorboard", offering a real-time overview of
system stability.
Like smoke detectors in a building, sensors highlight exactly where problems occur, enabling rapid detection and proactive issue resolution across the SAP landscape. |
What is a sensor ?
Everything is running smoothly and there are no known concerns. But on a the system as large and versatile as ours, we should be careful assuming everything is fine. How can we ensure operations are running smooth ? How can we create an overview of potential issues ?
If every room in the building has a smoke-sensor, we can assume nothing is on fire in the building. The basement could still be flooded though. Installing smoke sensors as digital sensors that monitor the state of the system - is not a new thing. In network maintenance quite a suite of commercial products is available for this. And to extend the reach of these products into a live SAP system, sensors from this board can be added.
A sensor is mini-report that determines a KPI number. When opened it provides an explanation on what the KPI means and how it was determined - with enough detail to follow it up. A number with an explanation. Every time the mini-report is executed - the KPI is re-determined and the new result is reported. "How many dumps were thrown in the past hour". "How many approvals open tasks older than 2 days". "How many errored Idocs in the past week".
When sensor details are viewed, a popup-report is shown that explains how the KPI was calculated. In a detailed overview the sensor reveals how to follow up with what information. In most cases this is done in a result table with columns and data that are specific to the sensor.
Sensor logic can be set up to test any assumptions, whether technical or functional. This is where the real added value of a sensorboard shows: functional assumptions can be captured in a sensor.
- "We only use type 'B' for salesorders in 'Belgium'"
Sensor result: "24 issues" - with summary "24 salesorders that are not for 'Belgium'".
- "Our customers have a unique email-address"
Sensor result: "4 duplicates" - with summary: "Email duplicates: 4 duplicates".
As sensors are checked regularly through the framework, the sensorboard continuously reports an up-to-date compact overview of the state of affairs. On top of that, sensors can "call out" to users via email - the moment something has gone wrong, involving users the moment something falls over.
So the main theme for a (any) sensor is the KPI. In most cases the KPI indicates something is wrong. A higher KPI number indicates a greater severity of the problem.
The standard sensor types per topic
Measure the system health with sensors
Just behind reception in your office building, there is a panel with the map of all the floors in the building. Each room shows at least one small diode(light) which is never on. These diodes are linked to smoke sensors which are in the rooms. When a fire breaks out, an alarm will sound for the whole building and the room in which the smoke was detected will have it's diode light up in the map. When the fire fighters arrive, they will know exactly where to go. Valuable and life-saving minutes are spared. As a fire would progress, more and more rooms will "light up" on the map behind reception, a clear indication on how serious the issue is.
Using this setup for a system, allows overall system health to be monitored. A digital panel with sensors that continuously perform checks is a continuous health insurance. Not just for storage space or a number range that is nearing it's upper limit, not just to ensure no mission critical jobs failed recently. Also for to check functional assumptions on the data that is being processed. Should a certain bit of information be set up on new projects ? Just set up a sensor on the number of projects that don't have this bit of information.
Sensors can be reported as a little red (or green or blue) icon. Or as a small stamp-sized summary with essential information.
Example of a sensor - as shown on the sensorboard.
Sensors are updated regularly and continuously, so the information on the sensor is up-to-date. The sensorboard itself is also regularly refreshed (every 20 seconds) so the board itself is also up-to-date. Let the board do the actual checking for you.
What?
System health monitoring tool as active sensorboard. Sensors with KPI for just about anything.
Where?
S/4 Hana systems.
From version 750.
How?
Check the board for up-to-date KPI's and get a notification when something goes wrong.
| Executive summary |
The Sales Order Health use case demonstrates how the sensorboard can be applied beyond technical monitoring to manage
and optimize business processes in real time. By combining standard sensor types, a dedicated group tracks job execution,
application logs and KPI's for sales order processing - without requiring additional coding.
Through parameter adjustments like error thresholds, delays and schedules, teams can fine-tune notifications and workload. Historical KPI tracking and visual analytics provide insight into trends and performance peaks. Overall, the setup shows how the sensorboard delivers continuous, configurable and transparent process monitoring that adapts to business needs. |
A use case
The sensorboard is up and running and the obvious sensors are on there somewhere. The obvious sensors being the dump-counter or the number of batch jobs that failed recently. If something derails, the board will inform the subscribers for the "system health" sensors.
That's not the use-case we would like to emphasize here.
Sales order health
There is a job that checks and corrects sales orders. The job is called Z_SALESORDER_HEALTH runs every 30 minutes. The process is called "Sales order health" and a group with the same name is added to the board. The following sensors are added to the group - using sensor types that are already available (standard):
- To monitor the
Z_SALESORDER_HEALTHjob, a sensor is added (sensorSM37SINGLEavailable in the standard setup) to test some of the job specifications. In our example we want to make sure the job actually runs at least once every 2 hours, so theMAX_OFFLINEparameter (maximum number of seconds between runs) is checked. - The job also throws a special message when a certain sales order could not be processed. A problem, but not
a big enough problem to stop the whole job. A sensor is added to report on this message (sensor
SM37LOGS). On the sensor settings, the number and id of the message is specified to make the sensor count the number of times the message is logged. - Then another sensor is added - to ensure the job is not cancelled (sensor
SM37).
Thats 3 sensors on the batch job alone. - The batch also triggers a step that creates a Business Application Log (BAL) and saves it. If there are no issues,
this log is just for reference. But of there are errors on the log, our sensor monitor crew would like to be informed.
A sensor is added (sensor
SLG1) that will report on the logs with errors, specific to this process. The object and subobject for this will be specified on the sensor parameters.
As you may notice by now - most of the standard sensor type have parameter settings that allow using them for a specific purpose. - One of the sensors is for "Open SQL selections". It can be used to specify an SQL selection that results in a
counter or in a table with entries. The KPI is set to the counter result, or to the number of entries selected
(your choice). another
example (sensor
SQL) of a sensor that can be utilized without Abap coding. Count the number of sales orders for the day.
A sensor is designed to monitor the system. Sensor KPI's should give the insight, even without warning or error level. So the sensor on order errors may show 30 orders, if the sensor next to that shows 10.000 orders for that day - the overall priority is clear.
Sensors are instances of sensor types and the sensor type is where code logic lives. There are over 75 sensor
types available covering all kinds of general topics, like batch jobs or application logs. But also Idocs, work
queues (SMQ1, SMQ2, SM58, workflow event queue) and other topics. With the available sensors, a group dedicated
to a custom process can be set up - no coding required.
The sensorboard is also set up as a framework to which sensors can be added. With minimal coding effort, new
sensor requirements can be captured and made available on the board. This manual describes the steps to be
performed for this.
Sales order health - live monitoring
The board is live and the sensors are keeping a close eye on the batch job and the Application Logs. The following examples and responses indicate what can be done with live monitoring.
-
When starting up, error level was set to 1 and at the same time the complete
team had subscribed to the board. Issues were looked after almost immediately, sometimes by several team members
at the same time. As there were multiple errors per day, which were also resolved, the board started sending out
several mails to the whole team.
The sensor error level was increased to 10. This meant emails were only sent out when the number of errors crossed the 10-error boundary. As emails are only sent when the status is set to error, email traffic was reduced.
The other setting that was done here is the sensor delay. This was set to 2 hours, which meant that sensor execution was running less frequent - as the problems did not need immediate attention.Sensor design caters for updates every few minutes. This does not mean it makes sense to update a sensor with that frequency. The delay (in seconds) can be used to slow processing down.
After a few weeks, the issues that caused errors have been identified and most of them were solved. Every now and then, a peak in errors occurs. It's not clear when the last peak was and how many errors occurred.
The sensor logging "KPI graphics" is switched on, which ensures that sensor results are logged. After some time the sensor report (displayed when clicked on the sensor tile) is enriched with a graphical overview (at the end) and an overview of Average and Maximum recorded KPI values.This should provide insights on when measurement peaks happened before.
As the process is running quite smoothly, there are days when nothing concerning is being reported. The team sometimes forget to check the board, which shows issues for the current day only. Have we missed something ?
Using a sensor parameter, the selection is changed to check SLG1 entries for yesterday and today (2 days).
In addition, a new copy of the Application Log sensor is added which looks back 2 weeks, skipping the past 2 days.
Business is going so well that the team that is looking after these orders is split into 2 teams.
The batch job is also split into a job for each team and the group and all it's sensors are also copied/adjusted. The only topic that could not be separated is the Business Application Logs, for which an adjustment needed to be done. Each team would get their own subobject on the report that creates the logs.
The system sent out emails to all subscribers at 2am in the morning. Team members complained.
The group was assigned a schedule "Office hours only" which ensured the sensors on the group were only checked during office hours. This schedule also takes Christmas into account.Sensors that are not operational because of the schedule, will show a Zzz-icon to indicate they are "sleeping/pauzed".
Schedules are available as a group feature. They describe when sensor checks are to be carried out for the (all) sensors of a group. The group execution calendar - is available in the Sensor settings application.
A lot of changes have been done to the settings on the settingsboard. One of them even has a documentation reference set up. As a few changes to the setup are available to test - on the acceptance system - testers want to use the sensorboard settings from production.
The whole group (groups) are downloaded from the production system and uploaded into the acceptance system. functionality which is available from the Sensor settings application.
To get a feel of the Sales Order flow, a sensor was set up. With an open SQL selection that included a create date and create time, the number of orders were selected for the past 14 days. The sensor executes selection for the past 14 days and again for the 14 days before that, to calculate the growth/increase (or decrease) as AEX-like index. Once this was set up, the sensor settings were copied to 7 days, to perform the same measurements with a shorter period.
These sensors don't even have a warning limit or error limit. White sensors that are there as a sign of good health. This also started the discussion on measuring order value instead of number of orders. Which can also be captured in a ready-to-use sensor (theSQLINDX). Today the count-based and value-based sensors sit on the board next to each other.
These usage examples could give you an impression of the control over sensors and the insights sensors provide. With over
75 operational sensors "out of the box" - there are many more examples to describe. Note as well that there are 2 open SQL sensors
as well (SQL and SQLINDX) - which feed on the selection of your preference - without invovling any abap coding.
What can be monitored ?
Monitoring can be done in a broad spectrum. Ranging from relevant to the whole system down to a dedicated process like month end or order processing.
If you can count it, you can monitor it.
Organizing sensors
The main component in organizing sensors is the group. Have as many as you like/need and place the same sensor in several groups. The group is defined for a use case.
Duplicate sensors
A sensor can only be available once in a group. Is your sensor also available in other groups ? The system will execute the sensor only once and apply the results to all groups.
| Executive summary |
Each sensor's color reflects its KPI status - green for normal, yellow for warning and red for error, which can trigger
email alerts. Sensors without limits stay white for silent observation only. Group-level priorities (P1-P3) define the
overall importance of alerts, ensuring focus on the most critical areas.
The heart of the sensorboard: sensors and their states. |
Sensor states: warnings and errors
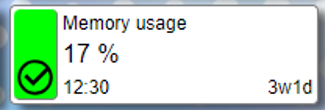
Every sensor is displayed in a given state. The KPI indicator determines the state of the sensor. When memory usage exceeds 80%, the sensor should warn us (yellow), when it exceeds 95% the sensor should show the error state (red) and even mail us about it. But the sensor KPI does not always throw warnings or errors. Key figures can also be added just to keep in check with the overall process.
Overview of sensor states
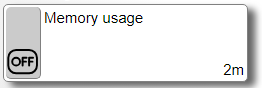 |
The sensor is listed on the board, but is it not active. It will execute when clicked on - presenting the KPI results from the moment. But the scheduled updates will ignore the sensor. |
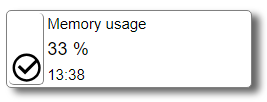 |
The sensor is reporting accurate KPI details, but it has no warning limit or error limit. This sensor will thus never turn green, yellow or red. It shows accurate KPI results anyway. |
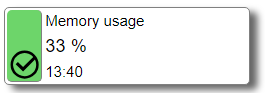 |
Here's a sensor (these are all the same sensor, except for the last one) which has a warning limit or error limit (or both) set up. It shows as green because the KPI of 33% is less than the warning limit (and error limit). Green Sensors can turn yellow and/or red. |
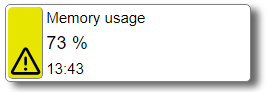 |
Things are getting a little more serious now. The KPI is 73% which is above the warning limit (70%). No need to panic, but maybe keep a closer watch on the board. |
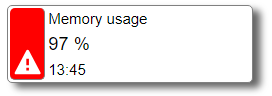 |
The sensor KPI (97%) has exceeded the error limit that was specified on the sensor. The sensor requires attention and an email will be composed and sent out to all subscribers of the group in which the sensor sits. Note that the email is composed only when the sensor is set to the error level. |
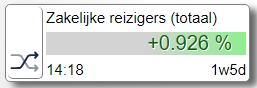 |
Some sensors deliver their KPI as an analytical deviation percentage, much like the AEX-index. The percentage shown can be both positive and negative. When the warning limit and/or error limit is set on this type of sensor, it will work like regular sensors. |
The displayed information is the time of the most recent measurement (14:18) and the duration in which the sensor has been in it's current state (1w5d for 1 week and 5 days).
So it is the KPI that determines the state (and colour) of the sensor. Each sensor has their own KPI limit for the warning state and/or error state. Warning limit and error limit are not mandatory, so some sensors will never show as red/error (these are shown in white).
Priority
All animals are equal but some animals are more equal than others. Setting the priority of a sensor, is not really an option. As sensors can live in several groups, the priority is not a sensor topic. Groups can be assigned a priority, ranging from No priority / P3 - Low priority / P2 - medium priority to P1 - top priority. Thus priority is determined per group and applies to all sensors on the group.
The group priority is shown as e.g. P1 just left of the group title (check the overview examples).
The priority is just a label. However the sensor heartbeat can be used to control priority matters. The sensor board
heartbeat batch job normally runs every 3 to 4 minutes processing all groups. As the priority is available as selection
parameter (select-option) on this batch job, it is possible to process P1 priorities more often and e.g. the groups without
priority only twice a day. Check out the SENSOR sensor: it will show what jobs are available (up and running)
on your system.
| Executive summary |
The sensorboard (transaction ZEN) is a central dashboard for monitoring system health through live KPIs. Users can
personalize their view. Each sensor provides up-to-date details and can be interacted with using shortcuts:
|
Show the sensorboard
To show the sensorboard use transaction ZEN.
The word zen means medidation. To practice zen has many aspects: to calm down, to (re)determine your motives, to be mindfull in daily life, to reflect on yourself. It is all connected.
A fitting name for a cockpit application on the health of the system.
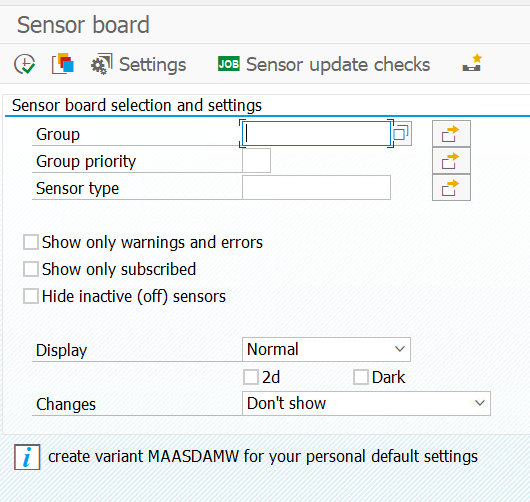
The sensorboard application - transaction ZEN
The selection screen of ZEN hosts selection and display options. Try them out and find out what works for you. Once you're settled, just save the settings as a variant with your user ID as variant name. The next time you start ZEN, this variant will be used.
As the sensorboard is a single board that is available to the whole organisation, it will have groups that are of no interest to you. Just select the groups you want to see (or exclude groups you don't want to see) via the selection screen - and save your variant - to personalize your own board.
Once the board is shown, a dashboard like overview of sensors is displayed. Click on a sensor to get an up-to-date explanation of the KPI that was shown. Up-to-date: as a click on the sensor will present the latest sensor execution details. The system will store any new results, so other sensorboard users will be presented the latest KPI results.
The board also hosts the following functionality on sensors - at your fingertips:
- SHIFT+click = Execute the sensor
When you click on a sensor, the latest recorded sensor details are shown which can be anything under 6 minutes old. For sensors with a delay, the information can even be older. The actual age of the recorded details is shown as sensor detail. Should you want to execute the sensor for the latest details, you can use SHIFT+click.
- CTRL+click = Sensor settings
For users that have access to sensor settings, CTRL+click will open the settings editor for the selected sensor. Press enter to focus on the settings and take things from there. Note that the sensorboard uses 2 authorisation levels. Authorisation for transaction code
ZENfor the sensorboard andZEN_EDITORfor the sensor settings application. - ALT+click = Sensor data report
This will also execute the sensor and present the data that is presented on the sensor itself as an ALV report. This functionality will not be available or make sense on all possible sensors, but it can also be a good way to follow up on issues.
- CTRL+ALT+click = Save sensor history
This will execute the selected sensor and store its results as historic sensor data. Historic sensor data can be reported in "Report historical data" where previously logged sensor data can be compared.
The board as oData service
The sensorboard can also be used through oData services, backed by a RAP application. These services provide an overview of the board as well as the immediate execution of a single sensor, revealing all it's details (effectively everything that is on the sensor detail report).
Through this channel, the complete board can be made available as Fiori app or web app.
| Executive summary |
When a sensor reports a critical (red) status, the system automatically emails all subscribed users a detailed report on the issue.
Notifications are sent only to authorized SAP users or approved shared inboxes.
All recipients are transparently visible through SAP tools or the sensorboard to ensure accountability and controlled distribution of business-critical information. |
Receive an email on calamities
The moment a sensor turns red, a calamity is assumed. Sensors that show faults should be followed up. This can be done on one of 2 ways: solve the issue or adjust the error level on the sensor (Mozes and the mountain).
The moment a calamity occurs is an important moment. An email will be composed and sent out to all group subscribers. The email will show the sensor summary along with detailed information on the sensor. Users can subscribe to a group by clicking on "Not subscribed".

The user is currently not subscribed for the Interfaces group.
An email will be composed and sent to the email address that was set up for the user (transaction SU01d). The mail contains a summary of the sensor with details on how the KPI was determined. The mail content should hold enough information to determine what happened and what can be done to solve it.
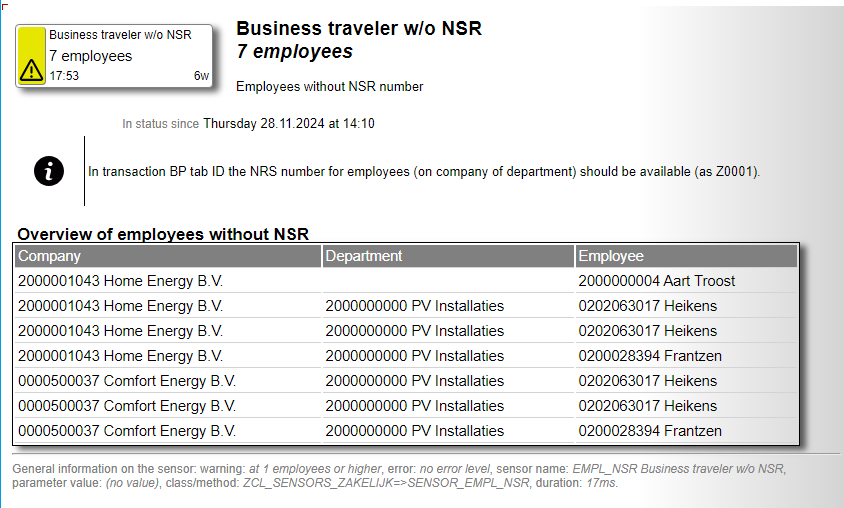
Example of an email notification
Every sensor will have it's own way to report what happened. The following information will be available on all sensor reports:
- In status since - the moment the sensor was set to the error state.
- Documentation - (optional) link to relevant documentation (e.g. Sharepoint).
- Warning - the KPI level that would make the sensor state yellow.
- Error - the KPI level that would make the sensor state red.
- Delay - (optional) the sensor delay in minutes. This is for sensors that do not need to be checked very often, e.g. sensors with a long runtime or sensors that have a very steady KPI level.
- Sensor name - the internal name of the sensor (uppercased text code).
- Parameter value - the parameter settings for the sensor.
- Class/method - the class name and method which holds the Abap logic for the sensor.
- Duration - consumed runtime in milliseconds.
- Result KPI - the sensor outcome (KPI = Key Performance Indicator).
Who can receive notifications ?
The information on notifications can be considered very business-relevant and sending out an email on business-relevant information should be regarded as a "handle with care" situation. The sensorboard user strict rules on these settings, making sure there is a healthy transpacency on who receives email notifications.
Email to SAP users only (*)
The email address of that is used to send a notification to is the email address that is specified on the user master data. The first available email address will be used. This means a privately used email address can not be supplied, unless the user has the authority to change their own user settings (which is poor practice - from authorisation viewpoint).
(*) Do note the next paragraph.
Notifications to a shared inbox
The shared inbox can also be linked up. Shared inboxes are viewed/monitored by
multiple people and may not have an SAP user counterpart. To cater for shared inboxes,
user id ZEN_USER_01 (fictional) can be set up through sensor type SUBSCRIBE.
Once set up, the fictional user can be subscribed to a group (or groups) and notifications
will be sent out when needed.
This can of course also be used to send out notifications to a private email account, which is regarded a hack (using functionality for which it was not designed). Note the next paragraph on transparency - if you will.
Transparency on email receivers
It should not be a secret where email notifications are sent out to. Standard SAP's
outbox (SOST) is available to check who is receiving mails. But this info
is also available from the sensorboard itself. Click on the title of the group to get
an overview of group details, with email receivers. This will reveal who is interested
in the group - which can also be regarded as an effective way to find group owners.
In addition to that there is the SUBSCRIBE sensor type. A sensor that
will show all receivers (for all groups) in a single overview. Starting with the special
cases - for shared inboxes. For more details on how to set this up, please check the
manual for sensor type SUBSCRIBE.
| Executive summary |
The Sensorboard enables real-time monitoring through organized groups of sensors, offering flexibility, personalization,
automation and control.
|
Feature overview
The setup of the sensorboard with groups of sensors enables organizing the board. An overview of means to organize and work with your sensors:
Organize: arrange groups and sensors
- Create a group and add some sensors. The group should form a logical subject like a proces. But it can also
be used as a place where sensors relevant to a department reside. Or even someone's personal preference.
It is good to realize that the same sensor can be used in multiple groups. The sensor results are determined once and applied everywhere.
- The user with special requirements - can have his/her own group.
- Set the sequence in which groups are displayed by drag-drop on the main overviews.
- Set the sequence in which sensors are displayed in the group by drag-drop on the main overviews.
- Each sensor has it's warning limit and error limit, which is set for the group. Thus a sensor that is throwing errors in one group, can be displayed without warning or error in another group. Thus: what is super important in one group, can be purely informational in another.
- Each sensor has it's own parameter settings (optional) and text settings (optional). Use F4 on the parameters field to let the system inform you on the available options (specific to the sensor). And use the help button to let the system inform you on available options in the sensor long text. Again relevant to the sensor being processed.
- Sensors that don't have a warning and/or error limit are still operational and still deliver an up-to-date KPI.
- A sensor which is Off can still be executed. It will update it's KPI and report it's details as if it was active.
Personalize: your sensorboard
- The look and feel of the board has 3 options, all available on the selection screen. Normal, Compact and Super compact.
All these options will show selected sensors in their respective groups. Even the Super compact option (which shows a sensor as a tiny colored square) works as an operational board. Click on a sensor to execute it and reveal it's details. Hover over the sensor to reveal it's title.
- The selection screen of the sensorboard can be used to focus on sections of the board. Select specific groups or even specific sensor types.
- The other options on the selection screen, help quick focus on priority groups or only the groups to which the user is subscribed.
- Once the settings are applied, all the end user needs to do is save his/her settings as a variant. This will make the sensorboard pick up on user-specific settings the next time the board is started.
Enrich sensor documentation
- Every sensor can be enriched with additional documentation. So whenever you feel the available introduction text on a sensor is insufficient - you can add to this text.
- Use sensor longtext parameter
INFOfor this. - .. or use
INFO:ENfor the English description andINFO:NLfor the Dutch version. - Is the added documentation only applicable for a specific sensor (and not all the sensors of the same type)?
Set it up as
INFO:DOCU01orINFO:DOCU01:ENand use theINFOsensor parameter to make it involve the text. - Enriched documentation settings can easily be moved through the landscape - as they are part of the sensor type settings (upload/download).
Emailing and subscribers
- Users can subscribe to a group (or groups).
- Shared inbox users can subscribe to a group (or groups) (see sensor
SUBSCRIBEfor more on this). - Shared inbox users support multiple receivers.
- Subscribed users receive an email on the sensor or sensors that "turn red", the moment they do.
- Subscribed users can also receive a regular overview with all the sensors of a group - periodically.
This feature can be used for periodic KPI overviews, e.g. analytical sensors (the AEX-like index sensors that show growth in percentage) as mail overview.
- An overview of all subscriptions is available on sensor
SUBSCRIBE. - Whener emails are sent out (by the
ZSENSOR_ENGINEreport) - email receivers are logged on the batch job log.
To receive overviews at regular intervals
The sensorboard is not just about errors and issues. Some KPI's are used as performance indicators without ever being faulty (white sensors). To receive an email about these sensors:
- Create a group and add some sensors.
- The end user should subsribe to the group (subscribers can also be assigned by others).
- Batchjob
ZSENSORS_ENGINEis scheduled at set intervals (e.g. daily) - with option "Inform subscribers for groups (email)". - All active sensors on the group are listed in an overview mail to the subscriber(s).
- For sensors that have historic data, an SVG image or images are available on the sensor. To make this available on email, the complete sensor report (including historical graphs) is attached to the email.
Keep track: sensor logging
- Sensor logging can be switched on a sensor. This will log the KPI of a sensor and results will be added to the
sensor detail screen.
For some sensors the behaviour of the sensor can be relevant. As sensor KPI values are often a reflection of "how bad" things are going, a view on it's historic values can be valuable. When logging is switched on, the system will monitor the KPI values and report them as a bar-chart going back up to 90 days.
- The other means of sensor logging is the snapshot of sensor details. This is much more elaborate than just keeping track of
the KPI value.
With the comparison report logged sensor results from 2 measurement moments can be shown side-by-side for comparison.
Find the comparison report on the sensorboard selection screen or the sensor settings editor.
- Note that both these logging methods can be used on any sensor.
Secure: sensor settings - backup and move
- The sensor settings application is equiped with download/upload functionality, which can be used to move your sensorboard settings to other systems (dev/test/prod).
- The format used for upload/download (and backup) is JSON - which implies changes can be applied to it (if you dare).
- A backup for a group or a backup for the whole board can be created - which will be stored in the database.
With the power to do upload and download also comes the power to whipe out all settings. Hence backup functionality is available for the groups and sensors (and sensor settings) of the board.
- Backups can also be scheduled. The sensor engine (the background job that comes with the sensorboard) has an option to determine
and store a backup for the whole board (or a specific group).
To keep things from duplicating: each backup is checked against the previous backup, to determine whether storing the new backup is really necessary.
Changes on a sensor (apart from sensor text setting changes) are logged in a BAL (Business APplication Log) logging. Which is available from the sensor settings editor. Hence changing settings is not an anonimous matter.
Running sensor checks
- Sensors are checked every few minutes - which is controlled by the sensor engine background job.
- When a sensor is slow, the framework ensures it is skipped in the next run.
Thus a sensor that consumes a full hour will cause the sensor engine to run at least that hour. The engine run that follows after only a few minutes will detect that the slow sensor is still being processed and skip it. Effect: slow sensors don't impact the overall board.
- There is a delay setting on the sensor. This can be used to limit the number of times a sensor is checked during the day.
- There is a schedule for groups. This can be used to run the sensors on a group only during office hours.
Schedules can be customized to describe a week with working times. And in addition calendar days (dates or date ranges) can be added to define a hyper-care period or christmas.
- The sensor engine can be used to slice and dice job runs. This means the job can be run every 3 minutes for high priority groups and every 15 minutes for the less important ones.
Following up
To follow up on the sensor, or resolve the issue the sensor brought to your attention, every sensor will have their own steps. The sensor tile only shows the KPI, the sensor report (click on the tile, or check your email) should explain the sensor. A brief description which refers to e.g. the transaction code to check explains what the sensor measured. Most sensors also show more detailed information, often as a table, which should clarify what objects were involved in the KPI determination.
Sensors which list specific details as a table can also disclose the information in an ALV report. This can be effected from the Sensorboard by clicking ALT+click on the required sensor. Alternatively find the sensor in Sensor Settings and select the Data preview button.
To help resolve the sensor issue a reference to documentation can be set up on the sensor. Such document can describe the known issues in more detail - if needed.
Once the issue is resolved, the sensorboard can be used to check the solution. As the sensor should become green (or yellow) again. Start ZEN, find the sensor and click on it. The check will be performed again and results should help you determine whether the applied solution was sufficient.
The sensorboard also helps determine the effectiveness of the solution.
Instantly.
Censoring sensors
The power of a good sensor is that it explains what happened in great detail. Detail that can sometimes be linked to a person or data that should not become generally available to all sensorboard users. A small feature is available on the sensorboad that will hide the detailed content of a (any) sensor.
Sensors can be sensored.
A censored sensor works like any other sensor, with KPI determination and response to warning and error levels. The only thing it will not do is show the sensor detailed report, as this will state "Sorry! The detailed content for this sensor is censored.
To censor a sensor (e.g. SUIM, just add this to the sensor longtext of the SENSOR sensor type:
	/: CENSORED
	/* SUIM
	/* SUIMHISTORY
	/* SUIMSLEEPERS
The detailed content of the
SENSOR shows which sensor types have been censored.
Detection
In under 10 minutes, an email on a potential issue is sent out.
Root cause
The root cause analysis gets a real healthy start with the sensor report.
Multiple sensors
Most mishaps show as a series of issues. The board reveals them.
| Executive summary |
The sensorboard engine is the operational core of the system - its heartbeat - responsible for refreshing KPI data,
sending notifications and triggering automated fixer jobs. Scheduled every few minutes, it ensures continuous
monitoring while skipping locked or long-running sensors to maintain performance.
Additional engine functions include detailed logging, housekeeping, and support for feeders (which generate sensors dynamically) and fixers (which automate issue resolution). Global board settings - such as visuals, documentation links and notification configurations - are managed through dedicated self-service sensors, ensuring a customizable, automated and transparent monitoring framework. |
Running the board
The sensorboard comes alive with the sensor board engine, a report that needs to be scheduled as a batch job. The engine is the heartbeat of the sensorboard. Scheduling needs to be set up with a maximum of 5 minutes interval between jobs. 3 or 4 minutes are preferred.
In extreme cases, a single sensor could consume a lot of performance. The architecture of the sensorboard caters for this: each sensor run is locked. So even if a single sensor would consume a full hour, new next sensor engine run would do it's job and skip the slow sensor (because it would still be locked).
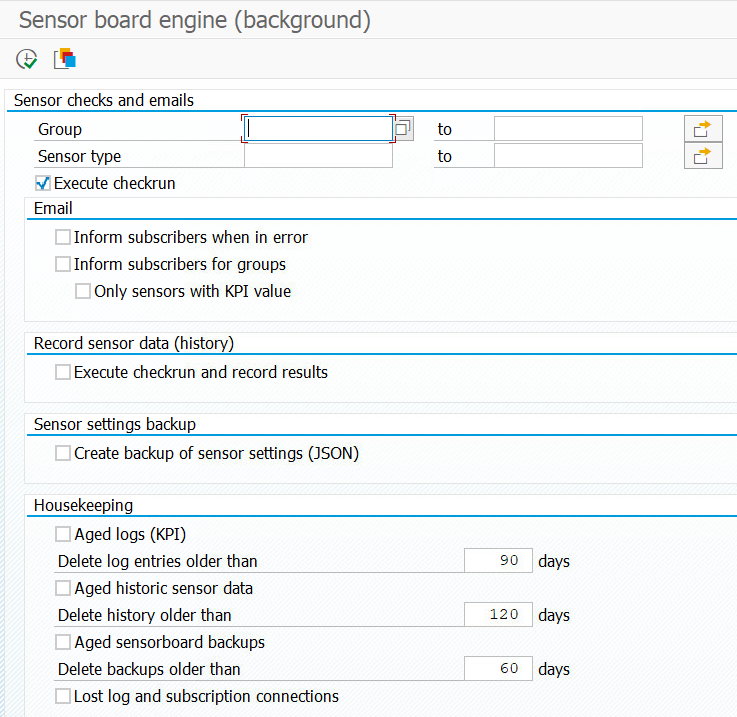
The selection screen of the sensor engine (ZSENSORS_ENGINE)
Without the sensor engine job, the sensorboard would be fully operational. The only thing is that sensor KPI results would not be updated and notification emails would not be composed. Operational but halted.
The sensorboard has a self-service sensor, which checks the state of affairs with the sensor engine job. It will present itself in the selection screen of the sensorboard - when errors occur. The details on the sensor result should explain what's missing.
The main tasks for the sensor engine
The sensor engine captures all relevant tasks in a single report. Note that not all tasks should be performed every few minutes, so it is quite normal to schedule report ZSENSORS_ENGINE several times with different variants and different periodicity. The main tasks:
- Sensor check heartbeat
Sensors KPI calculations are done periodically through this step. Without it, the board will show old information (and the times of last refresh will show this). - Compose and send emails
Subscribers will receive emails on the sensors that turned red - on their groups. Unless the sensor engine is not set up to do this (checkbox on the selection screen).
The available options are- enable emails to subscribers when sensors are set to the error state and
- send out all sensors for a specified group to the subscribers. With this option, the receiver is informed about sensors as "weekly
KPI's" or "Last month in numbers".
Your system is probably more than likely set up to send out emails, for which a periodic batch job is operational. If the sensor response (usually under 15 minutes) is proving too slow - check out paragraph Boost notification performance below.
- Kick-start fixer jobs
Some of the sensor types can have fixer (FXR) functionality, which comes as a report that should be scheduled. Depending on the type of fixer this batch job is scheduled periodically at preset time intervales (e.g. daily) or using batch job events.Familiar with batch job events ? They can be used to trigger a batch job almost immediately, for which the batch job is scheduled as "waiting for an event". The sensor board engine will throw the event.
A step-plan:
- Make sure the event
ZSTART_SENSORBOARD_FIXERis available. TransactionSM64can be used for this.The event is used to trigger fixer batchjob(s) when applicable. An alternative event can also be used.
- Find the sensor board engine batch job and set the "Check and start events" checkbox.
This will instruct the sensor board engine (heartbeat) job to start events. Only if "listeners" are available.
- Schedule the fixer job(s) with start condition "After event" and fill in the
ZSTART_SENSORBOARD_FIXERevent. Set the event parameter value to the sensor type (E.g.SRT_MONI).
Now set the error level on the respective sensor. The sensor heartbeat will now respond to sensors that reach the error limit by sending out notifications to subscribers and also by triggering the fixer report. "As if the fixer batchjob is notified like a subscriber".
There are a few controls available through this setup.
- The duration in which issues are reported on the sensor (
DATINGandTIMING) - this will ensure the reported errors disappear after some time - which effects the max number of retries - The error level on the sensor - which should be set to 1 for a prompt response. Even if 20 problems are reported at the same time, all of them will be processed in the fixer job.
- The number of sensor-clones, each with focus on a detailed subject. The setup caters for multiple sensors for
e.g. the
SRT_MONIfixer.
Frequent retry - for a limited time period
So what happens is a sensor is set up with error level 1 and the sensorboard engine just added a new error to the already existing list of errors. A sensor in error with KPI=1 will be changed to a sensor in error with KPI=2. But the status of the sensor doesn't change. So no trigger for the batch job event. The automatic fix for the new error will not be executed, as the system has already done this when the sensor reached it's error state.
The work-around for this, is simple. Just set the
TIMINGparameter on the sensor. The sensorboard engine will detect this - which will make it trigger the batch job event with every sensorboard engine run. A feature that was added to enable fixer processing - for a limit time (specified withTIMING.. - Make sure the event
- Detailed logging
There is an option to capture detailed logging for sensors. Individual sensor settings need to be set to allow this function to work. As detailed logging of sensors consumes table space, it is recommended to set the periodicity for this job to no more than once every 2 hours.Check out what this is about, sensor results from the past can be compared to the current sensor results. Or 2 logged sensors can be compared (both from the past).
- Housekeeping tasks
The sensorboard can compose logging tables that will need to be cleaned up periodically. This and a few other housekeeping tools are also captured in the sensor engine, which would need to run monthly.
Boost notification performance
When an error occurs for a sensor to detect, the batchjob for the sensor checking (the sensor heartbeat) will need to run first. This is a batch job which will be running with a periodicity of anywhere between 1 and 5 minutes. This implies the issue could already be 5 minutes old, before it is first detected.
The heartbeat job will need to run itself, then it will compose a notification email which will need to be processed by yet another batchjob. So the time between something going wrong and actually sending out the notification email - depends on 2 jobs plus the runtimes of these jobs. Once the email is on it's way, it will need to travel across the world - which will also consume time.
Here's what can be done to optimize the notification via email process:
- Increase the periodicity of the sensor heartbeat job.
- Set the Email event as per parameter on the heartbeat job. This will trigger a batchjob event whenever
notifications were created. The effect is: the time the periodic batchjob for email processing needs to wait is
cut out. So where a worst case example would consume 20 minutes to be processed, it would now be less than 5.
The job for the event ? Step
RSCONN01. - You can also consider using the speedy path only for priority P1 groups and run the rest in a more relaxed mode. In fact, even when you schedule 3 speedy versions in the same minute - the overall setup would work and response times could drop to less than a minute.
Feeders (FDR) and fixers (FXR)
The sensorboard is a report with mini-reports that run at very regular intervals. The only updates the board will perform are re-determination of KPI values. No changes to the system are done. No automated fixes or automated preperation steps. We do however support feeders and fixers which are explained here:Feeders are stand-alone reports that are not part of the sensorboard framework, but it uses sensor data
to perform their respective tasks. The feeder (naming convention ZSENSOR_FDR_* where the * is
the sensor type) will target a controlling
sensor and create a series of generated sensors for it. The controlling sensor would e.g. report results for all companies
and the generated sensors will do the same with a sensor for each company. For the top 10 available companies. This job would
typically be run once or twice a day. Sensors that were created by a feeder-job will have the "BAPI" indicator set.
The idea here is that sensors can be made available based on data, rather than a lot of manual actions. The feeder.
Fixers are also stand-alone reports that target the issue that is reported on the sensor. When issues can be
repaired automatically, a fixer job (naming convention ZSENSOR_FXR_* where the * is
the sensor type) can be scheduled to run as often as needed and this job can involve the sensor details or just the
sensor text settings to perform it's task. Clean up aged loggings. Apply a targetted fix like creating
a relation or deleting one. The effect will reflect the sensor KPI in the runs to follow.
The idea here is that sensors from the board are aimed at locating issues and reporting about them. But where an automated fix is possible this should be set up - separate from the board.
The sensor manual shows sensors with fixer reports, find your example(s) there.
Sensorboard general settings
There are 2 sensortypes that are about the sensorboard itself. The Self-service sensor (SENSOR) and the Subscription
sensor (SUBSCRIBE). Ideally both sesnsors are available on the board through this is not a hard-requirement. This paragraph
reveals what settings they can carry - applicable to the whole sensorboard.
There are a few settings that are applied on the sensorboard, which are customizable for the whole framework. These are:
- The background image of the sensorboard, which covers the whole sensorboard (unless dark mode is selected).
- The location of the manuals, which is accessible from the Sensor editor.
- CSS additions for the sensorboard, should you care to adjust it.
- Batch job step details, which should be operational for the board.
- Censored sensors administration.
SENSOR).
The subscribers of the groups are listed on each individual group (just click on the group name from the sensorboard). However The
SUBSCRIBE sensor is also available - which will reveal all subscribers for the whole board. As subscribers can only be
actual system users, the email addresses of these users determine where notification emails go.
With an exception: shared inboxes. To cater for shared inbox receivers (an inbox for a department or external party) - sensor settings are applied. As these settings are user by the sensorboard for the sensorboard - it is mentioned here. General sensorboard settings: external users for shared inboxes.
More on this on the manual for SUBSCRIBE.
Heartbeat
A batchjob needs to run at least every 5 minutes - to re-determine the sensor KPI's.
The sensorboard heartbeat.
Self service sensor
When the sensor engine job is unavailable, a sensor will alert on this from the selection screen and on the board itself.
Subscription sensor
The SUBSCRIBE sensor hosts information about subscribers, including the shared inbox subscribers.
The complete overview of all subscribers.
eMail controls
Sending emails to subscribers can be controlled with the sensor engine job.
Sensor settings
From the selection screen of transaction ZEN button "Settings" is available. Users that are authorized to edit sensor data can use "Sensor settings" functionality.
- Create/change/delete groups (with priority and a schedule).
- Create/change/copy/activate/deactivate/delete sensors (for a sensor type).
- Create/delete subscribers.
- Move groups and sensors to other systems.
Sensor
The stamp-like tile that displays the KPI of a sensor.
Group
A folder with sensors.
| Executive summary |
The Group Settings tab defines how sensors are organized, scheduled, and prioritized. Each group gathers related
sensors and controls shared settings such as processing schedules, display order and alert limits. Groups can
carry documentation links and determine email notifications for all their sensors.
Priority levels (P1-P3) help manage critical monitoring, while flexible configuration allows focused setups - even for a single sensor - ensuring clarity, structure and control across the sensorboard. |
Group settings
Sensors live in a group of related sensors. Whenever notification emails are sent, these are for the (all) sensors of a group. In case a user is interested in a single sensor only, just create a group with only that sensor.
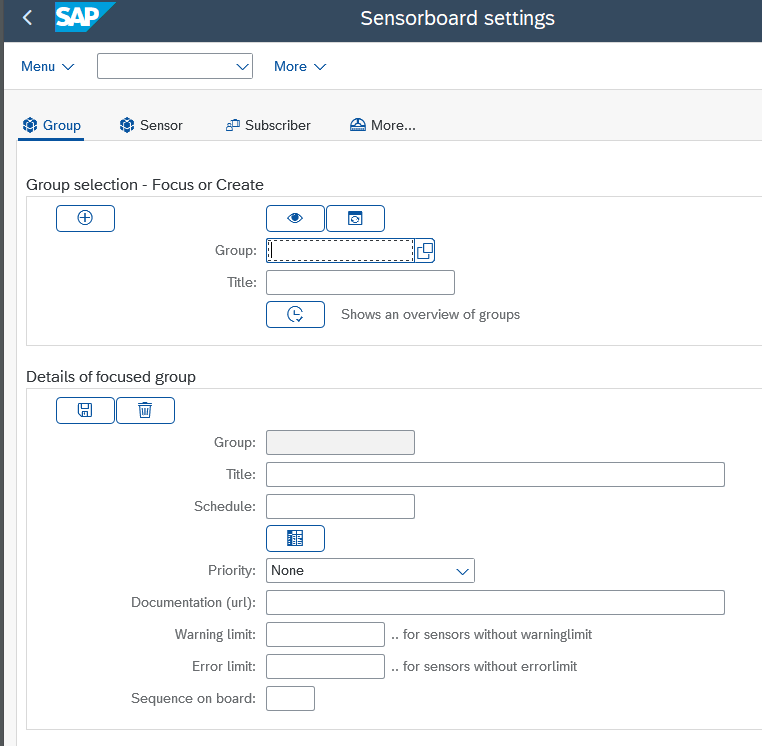
The "Group" tabulator.
The first 2 fields can be used to focus on a group - which will then be shown below. The "Details of focused group" will show details that can be changed. This setup is called a "line editor" and is used for the other tabs as well. First focus, then edit.
Available fields:
- Title: the name of the group
- Schedule: (optional) when the sensors of the group are processed, a schedule can be applied. This can e.g. be used to check sensors during work hours only.
- Sequence on board: (optional) can be used to influence the sequence in which the groups are reported.
- Priority: (optional) sensors can be prioritised via the group. Priority P1, P2, P3 and no priority at all are the possible values. Groups with priority P1 require subscribers on the group - otherwise the "Self service" sensor will trigger errors.
- Documentation: (optional) as for sensors, the group can also carry a reference to group documentation (e.g. on Sharepoint).
- Warning and error limit: (optional) The limits that are specified here will be applied to all the sensors on the group. Unless the sensor has it's own limits defined.
Priority for groups
Groups can also be assigned a priority, which influences the need for subscribers. A group with P1 or P2 Priority should also have at least a subscriber. The self-service sensor will report a problem on this.
Priority is always a serious matter. And the priority on a sensorboard can be a life-changer. The concept of letting something go wrong is a reality matter. Finding out about it quick is where the board will show it's value.
Another reality when it comes to priority is getting the right people involved. Thus one could argue that a group which is set up as P1 - high priority, which has no subscribers will still go unnoticed. P1, P2 and P3 priority is nothing more than a label. It does not send emails out faster or do automatic followup on processes. The real priority followup is done by subscribers and they may want to know early on whether the issue is from a P1 group.
Group
Folder with sensors that belong together.
Sensor
The main subject of the sensorboard. Packed with customizable settings.
Sensor type
The logic behind a sensor.
Subscriber
The person with keen interest on what happens in a sensor group.
| Executive summary |
The Sensor Settings tab is the central workspace for managing sensors - creating, editing, activating, testing and organizing them.
It enables users to search, configure and copy sensors with parameters, thresholds and documentation links. Optional fields
allow fine-tuning of sensor titles, limits and update frequency (delay).
Built-in tools support testing, data export (HTML) and detailed or historical logging for analysis and comparison. Together, these features make the tab a comprehensive control center for maintaining sensor behavior across the board. |
Sensor settings
The settings report opens focused on this tab - as it is likely to be the most commonly used one.
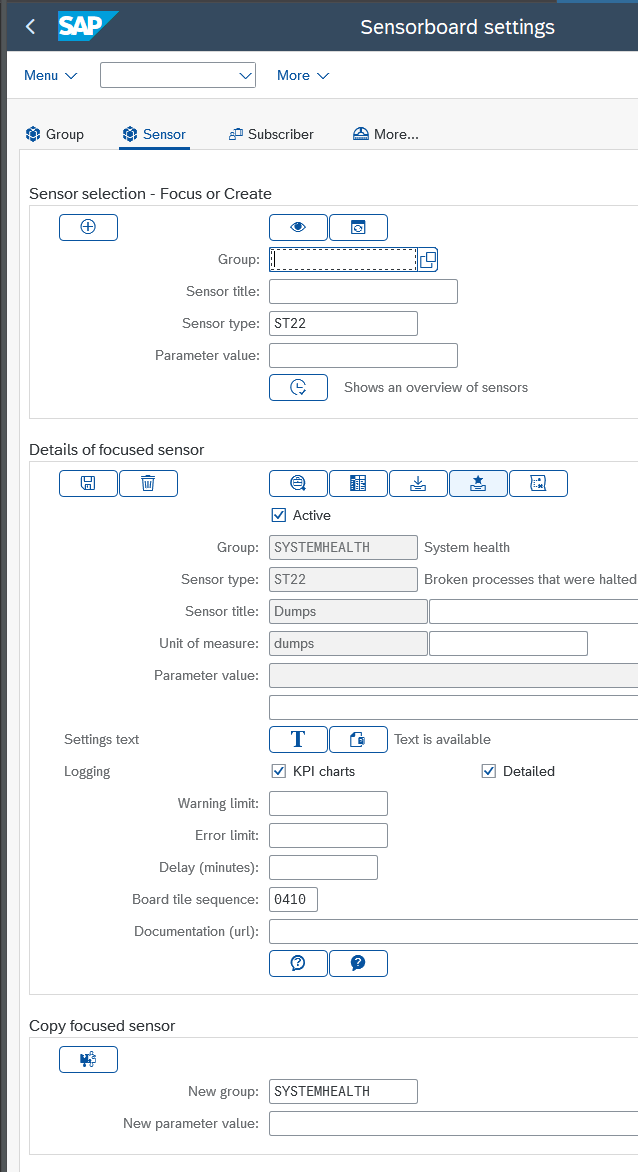 |
The sensor tab hosts a suite of functionality. Sensors can be looked up, created, changed, (de)activated, tested and copied to e.g. another group. Just make sure you save your changes. The main functionality:
|
Activate and de-activate a sensor New sensors are inactive (Off) by default. Sensors can be activated or deactivated any time. When an end user clicks on an inactive sensor - it is still executed and it will still determine its KPI. This caters for testing before activating. Inactive sensors are fully operational sensors, which are not automatically updated by the sensor heartbeat batchjob (the engine).
Sensor texts (optional) Sensor setting scan be available in the sensor (long)text or SO10 text. The "Text" icon will take you to this text. Do note: this is a sensor-type text, not really a sensor text. Thus it is possible to find the exact same text settings on different sensors (which will have the same sensor type). The button next to the text button will show documentation on that is expected - with an example text.
Fields explained
Sensor title (optional). The title of the sensor should be unique within the group. This is not mandatory but it is confusing to assign different sensors the same name. Is your sensor specific for a company code - mention the company code. When the title is left blank, the framework will provide the title (which is language dependant).
Unit of measure (optional). The unit of measure fort he KPI is described here. What is this number ? When the KPI Unit is left blank, the framework will provide one (which is language dependant).
Parameter value (optional). The parameter value is an additional instruction for the sensor. Sensors can be made specific for e.g. a company code. Or to control for how many days the sensor should select data. Use the F4 function on the parameter value field to find out which parameters are available for the sensor.
Board tile sequence (optional). Not a very nice task (tedious actually), but this field can be used to determine in which sequence the sensors are shown on the group.
Documentation (url) (optional). Documentation on the sensor is part of the sensor, however a reference to documentation can also be set on the sensor itself. This document could sit on Sharepoint and it could describe what the sensor is for or it could be used as a documented log of followup actions. The sensorboard will feature this link. And when sensor information is mailed out to subscribers, the documentation link will also be featured.
Delay (in minutes) (optional). Some sensors may run slow, which is not a problem for the framework. Every sensor check is locked, thus a follow-up run will simply ignore sensor that are still being processed. Nevertheless it may be a good idea to limit the check-sequence on performance consuming sensors - to save system resources. A delay of e.g. 120 would ensure the sensor is executed(no sooner than) every 2 hours.
Limits (optional). A sensor without limits will always be green/normal. It will still provide an up-to-date state of affairs and it can still be used to periodically update subscribers via an email. Sensors turn warning/yellow when reaching the warning limit and error/red when reaching the error limit, which will trigger an email to subscribers.
Fun(ctionality) explained
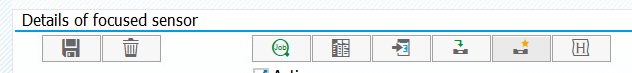
The list of available functions for a sensor
Icon 1. The sensor can be tested with the button on the far left (green hour-glass). A popup with the sensor tile details will be composed - just like the version from the sensorboard. The overview that is produced here does not have a maximum number of reported results (all will be shown, where the sensorboard will only show the first 500 entries).
Icon 2. The table-like icon can be used on any sensor (active or inactive) to report on the data that was logged on the sensor. This only works with sensors that report data in a table-format (which most sensors do).
Icon 3. The arrow into table icon can be used on any sensor (active or inactive) to compose a portable HTML document for the whole sensor. Portable HTML documents are singlular documents (.html) which contain formatting, information and images. They can be stored or emailed much like a PDF document. Share your findings or "keep a copy" somewhere.
Icon 4 and 5. These icons can be used to create a detailed log entry on the database. A detailed sensor log entry captures all the details that are listed on the sensor detail overview. The 4th Icon reports on what was logged. The report is set up to compare 2 measurement points or sensor-setail-snapshots.
Icon 6. The H-icon, which is only available when sensor logging is switched on. Logging The KPI results can be captured in a logging table. This will capture only KPI level changes (no further details). This icon will start a report (ALV) with the logged results.
Logging results are shown on sensor details in graphical representation like so:
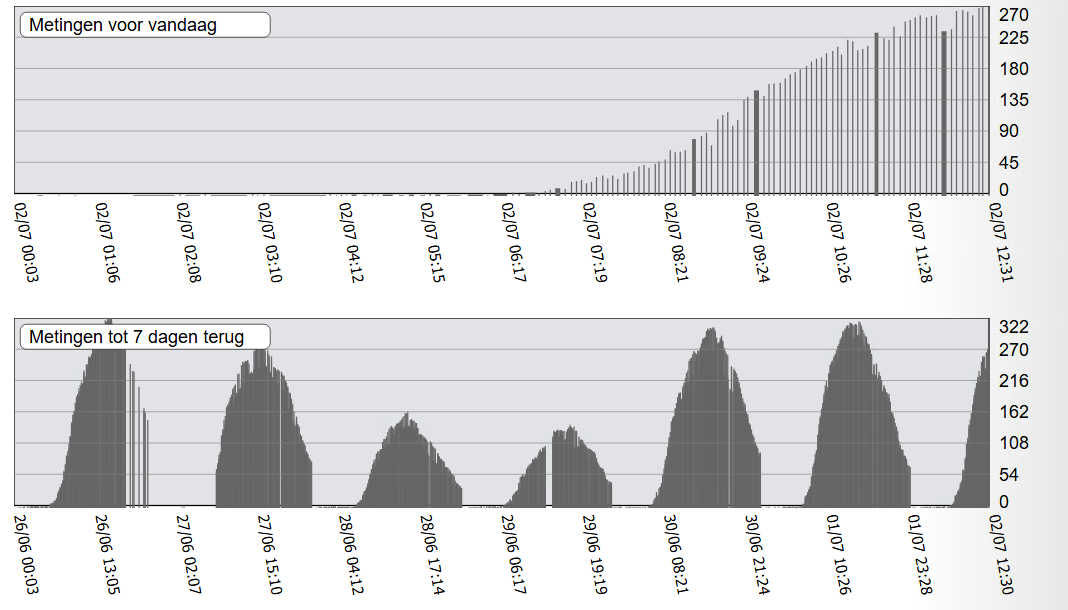
Logging of the work-processes sensor
Logging can be switched on and of any time. Do note that old logs are lost when switching logging off. The batch report for sensors also has an option to clear old data from the logs (under Housekeeping).
| Executive summary |
The Subscribers tab manages who receives notifications and KPI summaries from sensor groups. Users can subscribe or
unsubscribe directly from the board or through this settings tab.
|
Subscribers
Normally the end user can arrange whether he/she is interested in the group, with a single click on the board. Alternatively the settings application also has a tab for Subscribers (in which users can be subscribed or subscriptions can be removed).
End user controls their own subscriptions directly from the sensorboard.
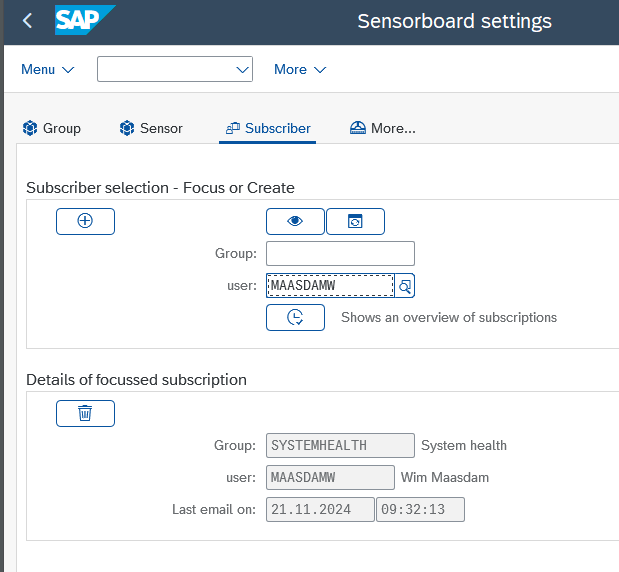
Subscriber details, which can also be used to list subscriptions (F8).
Groups also have an indicator for priority, which makes all the sensors on the group more important than other groups. A high priority (P1) group should have a subscriber.
Shared inbox
The sensorboard sends out notifications and some care has been put into who is allowed to be notified. The general rule is: only SAP users. The email address that is made available in SAP user settings is used for the notifications.The (only) exception to this the shared inbox. In summary:
- Users can subscribe to a group (or groups).
- Shared inbox users can subscribe to a group (or groups) (see sensor
SUBSCRIBEfor more on this). - Subscribed users receive an email on the sensor or sensors that "turn red", the moment they do
- Subscribed users can also receive a regular overview with all the sensors of a group - periodically.
This feature can be used for periodic KPI overviews, e.g. analytical sensors (the AEX-like index sensors that show growth in percentage) as mail overview.
- An overview of all subscriptions is available on sensor
SUBSCRIBE.
| Executive summary |
The Schedules for Groups feature allows controlled sensor execution based on defined working hours or calendar dates.
By assigning a schedule to a group, sensors can be limited to run only during business hours or paused during holidays,
reducing unnecessary alerts outside critical times.
Schedules are maintained as text-based definitions, specifying days, time ranges, and exception dates, giving administrators flexible, calendar-style control over when sensors are active and notifications are sent. |
Schedules for groups
Sensors are updated regularly, to keep sensor information up-to-date. When a working day is over, the sensors will keep checking and an email on something that has gone wrong in the middle of the night will be sent out to the end user. What's important during office hours, does not need to be as important outside of office hours. Solution: use a schedule.
A schedule is an execution calendar in which the days of the week (every week) can be described. In addition the schedule can work with actual dates, to e.g. specify Christmas or a holiday period. Specify the schedule on a sensor group to put it in action.
Schedule details are captured in a text, then applied to (all the sensors in) a group. The framework will recognize which schedules are available to select for the group.
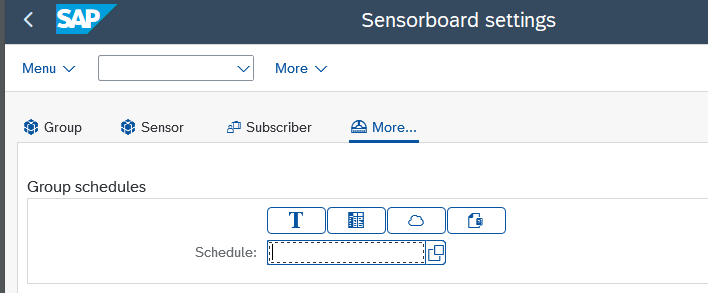
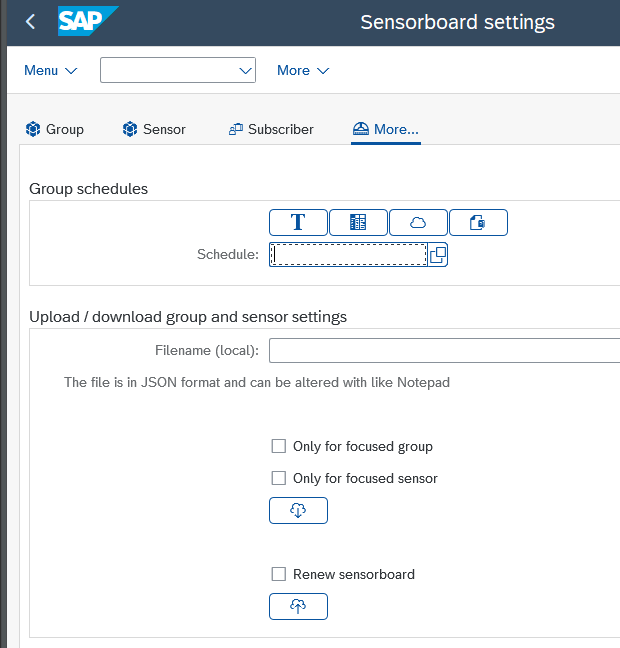
The More... tab on settings - the group schedule.
Select an existing schedule or supply a new schedule name to create one. Fill in the text as follows (example):
*	TITLE:Office hours
*	TIME:I,BT,070000,120000
*	TIME:I,BT,130000,170000
*	DAY:MONDAY
*	TIME:E,BT,090000,120000
*	DAY:TUESDAY
*	DAY:WEDNESDAY
*	DAY:THURSDAY
*	DAY:FRIDAY
*	DATE:E,EQ,20241225
Parameters explained:
- TITLE short description of the schedule
- TIME (optional) RANGE variables for start and end times. I,BT,070000, 120000 where I=Including times BeTween 070000 and 120000. Times need to be supplied as a range (from - to). When no time is supplied, there is no time restriction. When a time is supplied before the day, it is applied to all days.
- DAY indicates which days are on the schedule. A schedule without days will never be executed. MON, MONDAY, MAA, MAANDAG or 1 all refers to Monday.
- TIME (optional) can also be specified per day (underneath the day).
- DATE (optional) is a RANGE variable for dates. Use this to indicate that Christmas day should not be selected. Or use it to specify a 2 week hypercare period (extra checks).

Schedule settings can be reported - to check correctness
Working hours
The sensorboard is active 24 hours a day, every day. Use the schedule to limit it's operations to working hours.
International operations
The multinational is on-air 24 hours a day.
Create a group per 8-hour shift and put the sensors that need constant
monitoring in there (3 sets of the same sensors).
Then apply 3 schedules and get 3 groups of subscribers to subscribe.
| Executive summary |
The Upload and Download functionality enables easy transfer and backup of sensorboard configurations across systems.
Sensor and group settings can be exported to or imported from a single JSON file, serving both as a migration tool
and a complete backup.
Automatic and manual backups ensure data safety, with changes tracked to avoid redundancy. JSON files can be validated or edited externally for flexibility, while built-in tools allow restoring or replicating setups across environments. Together, these features provide secure, transparent and efficient management of sensorboard configurations. |
Upload and download
Sensors are easy to create, change and remove again. They form a customizable link between the sensorboard and factual data with sensor type logic in the middle. Once you're happy with the sensorboard details, they can be moved to another system using upload/download functionality. Sensor settings are explicitly not transportable - as this is about transactional data that needs to be adjusted on the system it is used on.
Download and upload of sensor or group with sensors.
The complete board can be downloaded to a single /JSON file. This can thus also be used as a safety backup for the board. Upload and download are great features, but there is also a risk: someone could un-intentionally whipe-out all settings. Best have a backup available.
Backups for sensor settings
The JSON download file holds all kinds and types of sensor data. Not just the sensors, also groups and sensor text settings. This makes a JSON download file a very compact and complete backup. But where should a backup file be stored ? And when should backup files be created ?
The framework can answer this one:
- First of all, a JSON file can be composed as backup and stored on a central location.
- In addition, JSON backups can also be stored in table
ZSENSORBACKUPS. The sensor editor has 2 ways to do this: (1) from a group (for a group) and (2) for the full system, on the "More..." tab. - Backups can also be created automatically, through an option on the sensor engine selection screen.
- When a backup is created, the framework will check whether there are changes in comparison to the last backup. No backup is added unless changes are detected.
- A backup that is stored on the
ZSENSORBACKUPStable can be retrieved by first storing it as JSON file.
A backup for a specific group ? A specific sensor (in a group) ? First set the focus on the group or sensor, then set the download option. There is a thin line between user-friendly and MVP, Minimal Viable Product. This setup is MVP, but gets the job done.
As the note on the screen suggests, the JSON (JavaScript Object Notation) download file can be edited in e.g. Notepad. JSON has a similar setup/function as XML without the <tags>. When the downloaded file is opened in Notepad, it will look readable but compacted. As we are dealing with JSON (which is a popular way to capture data in a file format), we can use on-line JSON validators. Search for "JSON validator" and select one, like JSON Checker - The JSON Validator and Formatter.
Copy the JSON content from the Notepad editor into a validator tool:
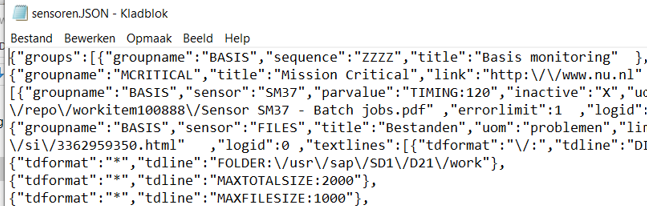
Download JSON file - opened in Notepad
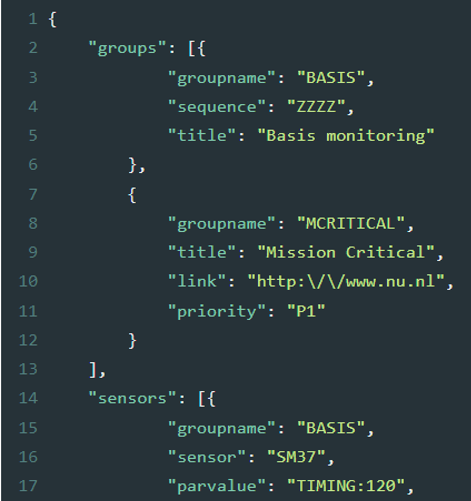
The same download JSON in a JSON validator (after validation).
Other than the simple fact that this is much more readable, the use of a JSON validator has another huge advantage. When you do your changes in the validator, these will also be validated (the correct syntax of JSON will be checked). The upload functionality only accepts correctly formatted JSON files.
Sensors can also have settings in a sensor text. These settings are also part of the sensor download, so when
moving sensors around, the sensor settings text is also moved. There is no upload/download functionality for
Subscription information. A schedule can be uploaded/downloaded with report RSTXSCRP, which is available via a
button on the Settings application.
With upload/download in place, board settings can be moved to other systems. And of course the other way around. When changes are done on the settings of the production system - these can be propagated back to the test environment.
A backup copy
It is always a good idea to have a backup ready somewhere. With upload/download this is easy to do.
Just make sure it's done
Planned backups
Backups of the sensorboard can also be planned. Results will be stored in JSON format, only when settings factually changed.
Just make sure it's done
Editing the download
If the download results are handed to a JSON validator, the outcome is reasonably readable and even editable.
This is not very easy, but easy enough for those who dare. The risk of errors is limited, as the maximum damage is strange sensor settings which can be dismissed.
Predefined boards
It can take quite some time setting up sensors with suitable warning and error levels. Try the predefined sensorboard groups which can easily be uploaded. These are available:
- System health - for the most common daily operations
- Interfacing - for interface queues
Technical matters
The sensorboard is set up as a framework. New sensors can be added from an existing class as part of an existing application, or as a dedicated class that has sensors as only function. The logic for a sensor is captured in a single method which requires a given naming convention (SENSOR_...) for the framework to find it. In addition the class which houses the sensor should implement interface ZIF_SENSORS. Method INTERNATIONALIZE (from the interface) should take care of sensor name and parameter descriptions. Once a new sensor is prepared, a tile can be created using the sensor settings functionality. Full step plan below.
A sensor determines a KPI value - and explains how it was determined. Value 0 means "all is well" and anything else means "something has gone wrong". Sensors can also show they couldn't do their job by returning -1 as KPI value.
So how would a sensor on daily sales work ? If the KPI would show the number of salesorders it would be accurate and valuable information - but it would not represent "a level of trouble". Consider this:
- Use a parameter or the sensor settings text to hold a base value for sales per period (hour).
- Let the sensor determine the number of created salesorder in the past period (hour).
- The KPI for this sensor can be 0,1 or 2, which is aligned with Normal/green, Warning/Yellow and Error/Red.
- When the count of salesorder is within a 20% range of the base value - KPI=0.
- When the count of salesorder is within a 50% range of the base value - KPI=1.
- And otherwise the KPI=2.
- Of course, the details on this will be available to the end user when clicking on the sensor.
Take away: the KPI's main function is to determine the state of the sensor. It does not need to be a meaningful number (though often it can be). The Unit of Measure should help understanding what the KPI is.
Sensors framework
Composed of classes, reports and tables.
Sensor specific coding
Lives in a single method and hosts settings in a more general method.
Embedding
Set up a sensor for your own coded solution on your own class.
The sensorboard framework
The sensorboard setup consists of a suite of components in a framework. There is a report for the sensorboard, a report for settings (and editing) and a report for the background execution of sensors (and emailing and housekeeping). Then there are several classes that capture all related functionality for the reports. All of these components can remain unchanged - when the framework is implemented.
The framework is documented using AbapDoc. Every method has was documented and Eclipse will be friendly enough to reveal this (in context).
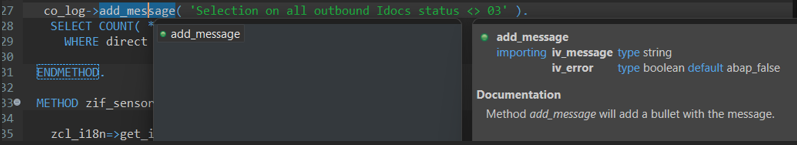
Eclipse editor revealing method-documentation (ABAPdoc)
If there is an umbrella system available, such as PRTG or Datadog, that could consume the information from the sensors -
a product-specific service could be set up to call the sensors from this framework. Thus KPI results can be disclosed to
sensorboards that monitor multiple systems. A sensor can be invoked with a single call to
ZCL_SENSOR_MANAGER=>EXECUTE_SENSOR(..). There is a RAP service for the board as well, ready to deliver the
sensorboard and sensor details as oData.
Used techniques
The board uses HTML to cater for it's sensorboard looks. Sensor tiles are packed with details and even more detail is revealed when hovering over the fields on the tile. In addition the HTML content is also used to compose a detailed sensor report as popup or as email.
SVG images
The images that are shown are SVG images. SVG or Scalable Vector Graphics is a technique with which the image is composed of drawing-instructions, embedded in HTML coding. This is not visible in Emails (yet). As the SVG technique is also used to compose graphics for sensor history, the mails are set up with an attachment. Opening the attachment will show the report including it's SVG content (as the attachment is opened with a browser).
Sensors can keep track of their KPI values in a log. This will be shown on the sensor detail popup (email) as SVG image, or on the sensor settings application in ALV form.
Sensor availability
The framework hosts exchange of sensors - between different systems. Thus a sensor that was set up for SalesOrder
monitoring in company A, can be set up in a dedicated class. The (abap) coding for this class can then be implemented
in company B without further actions. Sensor, descriptions, translations everything a sensor requires will be available
on the coding of the class. At this point class ZCL_SENSORS_STANDARD (32 sensors) and
ZCL_SENSORS_HOUSEKEEPING (10 sensors)
hold the bulk of the available sensors. But there is also a "self-service" and a "Remote board" sensor available on
ZCL_SENSOR_MANAGER which will
check the state of affairs on the sensorboard itself (like: is the background job for the sensorboard itself scheduled ?).
In addition, when the sensor framework is operational on multiple systems on your landscape, an RFC connection will
bring the number of error sensors from the other system(s) right to your board as sensor KPI.
There are a lot of "black box" classes on the framework, which will not require adjustments for your
custom sensors. More
that 50% of the overall coding is on individual (standard) sensors and to add a custom sensor all that will need to be done is add
a class with the sensor (or sensors).
No customizing. No threaded coding. Loads of examples.
You are encouraged to add sensor(s) to your own solutions - add your tiles on the board.
Sizes and counts
Version 2025-08 of the sensorboard framework consists of just under 20.000 lines of Abap coding. It has 12 classes for which 4 classes are dedicated to actual sensors - captured in just under 8.000 lines of Abap coding. There are 3 main reports covering the board itself, the sensor settings editor and the heartbeat job (engine). Another 5 reports cover smaller tasks.
All in all it took over 4 years from setting up the first sensor logic to date.
Steps: add a new sensor
Before adding a sensor to the framework, make sure you look at what is already available. Try to find a sensor with logic that resembles what you want to do. Sensor logic lives in a single method and starting off with a working copy is definitely the way to go. The class and method of the sensor logic is mentioned on the sensor detail (html) report.
Where should you add your sensor ?. Best avoid the sensor classes that came with the product, like ZCL_SENSORS_STANDARD
and ZCL_SENSORS_HOUSEKEEPING. These should be left unchanged to support upgrades. The options:
Custom sensor class
Create a new class to host one or more sensors. Demonstrated on this turorial.Embedded your new sensor method into an existing class
Add the interface to an already existing (custom) class and run through the below steps from there. This is the preferred option if the sensor type (or sensor types) is factually for the subject of the custom class.
Steps to create a sensor
For this step-plan, we are adding a sensor that determines the number of outbound Idocs with a given status.
- Choose a sensor type name
The sensor (or in fact sensor type) should have a unique name. A code of up to 11 characters that is not already available on the system. Run transactionZENand use F4 on the sensor type field to check. For this step plan, sensor typeMYIDOCSis used. - Choose where to implement
Create a (dedicated) class or use one that is already available on the subject. Our example class is dedicated and is calledZCL_SENSORS_PLAYGROUND ($TMP).
- Add the sensorboard interface to your class
The framework uses interfaceZIF_SENSORSto recognise the classes that can potentially hold sensor methods.PUBLIC SECTION. INTERFACES zif_sensors .
- Fill in sensor textual details
MethodZIF_SENSORS~INTERNATIONALIZEwill have appeared on your class, when the interface was added. This method needs to be implemented. Internationalize means "make available in different languages" - and we will do so in English only. Add the following method implementation to the class.METHOD zif_sensors~internationalize. ro_i18n = zcl_i18n=>get_instance( ). ro_i18n->feed( VALUE #( ( id = 'SENSOR:MYIDOCS:TITLE' en = |My Idocs (outbound)| ) ( id = 'SENSOR:MYIDOCS:UOM' en = |idoc| ) ( id = 'SENSOR:MYIDOCS:SUMMARY' en = |Playground sensor| ) ) ). ENDMETHOD.Note that the
zcl_i18n=>get_instancemethod can also take a parameter value for the pool. When supplied, the texts can be "overwritten" and more translations can be added using reportZI18N_EDITOR. More information on this is described in paragraph "Internationalization". - Create the sensor method definition
The sensor is calledMYIDOCSand it now has a name, uom for the KPI and a summary. The framework will use this on the planning board and for F4 functions. The next step is to create a public method for theMYIDOCSsensor. Name itSENSOR_MYIDOCSand add the following parameters:CLASS-METHODS sensor_myidocs IMPORTING iv_parvalue TYPE zsensors-parvalue OPTIONAL CHANGING co_log TYPE REF TO zcl_sensor_manager_log RETURNING VALUE(rv_resultcounter) TYPE int4.
This parameter set is the only proper way to link your sensor to the framework. Make sure the method name starts with
SENSOR_followed by the sensor type name.The parameters explained:
IV_PARVALUEor Parameter value holds the options that can be supplied on the sensor. An uppercased value that can hold control information, likeDATING:3orTIMING:120;EXTRA_DETAILS:Y;MESTYP:MATMAS.CO_LOGis the changing parameter for the sensor log. This will hold the details on the sensor detail report with an introduction, messages and a paragraph with a table (header, lines and footer).RV_RESULTCOUNTERfor the KPI number of the sensor.
- Create the sensor method implementation
Create the new method and set the returning parameter to -1. This is a way to let the framework know that no actual KPI measurement is in place (yet).METHOD sensor_myidocs. rv_resultcounter = -1. ENDMETHOD.
At this point, your sensor will be available. It can be added to a group and displayed on the sensorboard. Start transaction
ZENand go to Settings (or use transactionZENEDIT). Click F4 on the Sensor type field: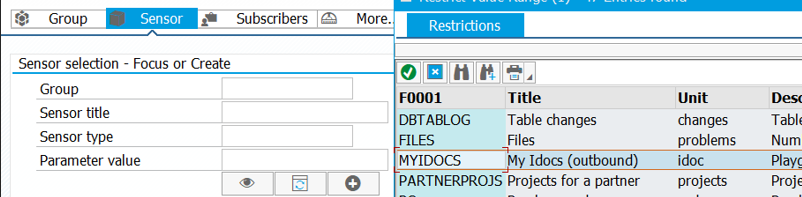
The new sensor is available and can be added to a group (F4 on Sensor type)Put the sensor on a board, run the board and click on it:
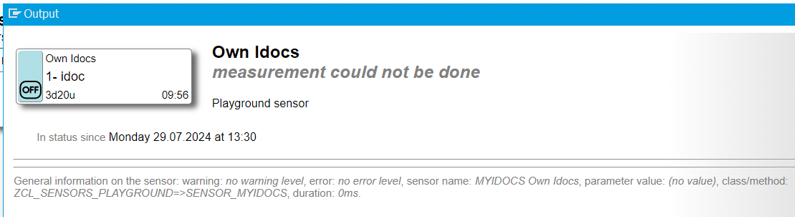
The new sensor as shown on the sensorboard (transactionZEN).The sensor is in place, but it has no sensor logic.
Coding example
- Add documentation to the sensor
Now all we need is determine a KPI value and explain it to the end user. Our playground example focusses on Idocs that were not processed correctly.Every sensor is set up with a brief explanation on what it does. We will supply this here, using attribute
CO_LOG- logging.METHOD sensor_myidocs. co_log->add_info( ' Transaction WE05 can be used to find the ' ). co_log->add_info( 'faulty Idocs reported here.' ). co_log->add_info( 'Note the direction = 1 (outbound). ' ). rv_resultcounter = -1. ENDMETHOD.
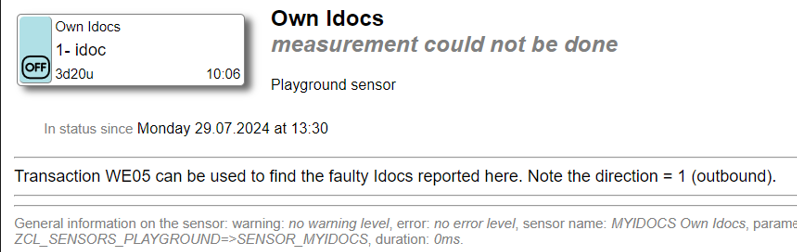
The sensor now shows a sensor description.Note that the sensor description can also be supplied in different languages. Check out the sensors in
ZCL_SENSORS_STANDARDfor examples. Also: as all texts of the framework and all texts on individual sensors are made available through the Internationalization mini-framework, they can be adjusted and even translated to other languages (see Internationalization). - Add KPI determination logic to the sensor
The KPI value is determined by selecting onEDIDC(control records for Idocs). We'll use methodADD_MESSAGEto reveal information on this selection.co_log->add_message( 'Selection on all outbound Idocs with status <> 03' ). SELECT COUNT( * ) FROM edidc INTO @rv_resultcounter WHERE direct = '1' AND status <> '03'.
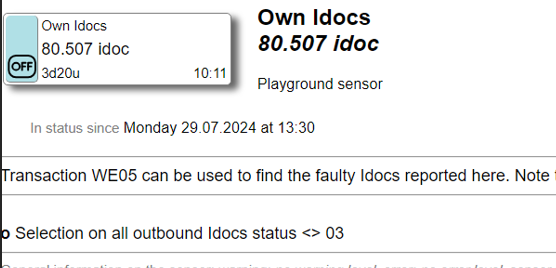
Example now shows KPI count and logging/explanationMake sure you remove the
rv_resultcounter = -1.line, as the KPI counter is now determined in the selection above.Clear and precise explanations are important. When a user subscribes to your sensor, these are the texts that are emailed. It should explain what is happening and what can be done about it.
Coding example
- Add the date parameter to the sensor (optional)
The selection often needs to include a date selection. TheDATINGparameter is the most common way to do this. First add the parameter to the internationalization method - to inform the framework a parameter is used.METHOD zif_sensors~internationalize. ro_i18n = zcl_i18n=>get_instance( ). ro_i18n->feed( VALUE #( ( id = 'SENSOR:MYIDOCS:TITLE' en = |My Idocs (outbound)| ) ( id = 'SENSOR:MYIDOCS:UOM' en = |idoc| ) ( id = 'SENSOR:MYIDOCS:SUMMARY' en = |Playground sensor| ) ( id = 'SENSOR:MYIDOCS:P:DATING' en = |DATING:10, select data for the last 10 days, including today| ) ) ). ENDMETHOD.TheDATINGandTIMINGparameters are standard. Other parameter names can be introduced where required. To pick up the parameter values, apply logic like so:co_log->add_message( 'Selection on all outbound Idocs with status <> 03' ). data(lr_dating) = zcl_sensor_manager=>get_dating( iv_parvalue = iv_parvalue ). if lr_dating-low is initial. lr_dating-low = sy-datum. lr_dating-high = sy-datum. endif. co_log->add_message( |Selection from { lr_dating-low date = user } to | && |{ lr_dating-high date = user } | ).If no dating settings are available, the default of today is assumed.It is a good custom to report the settings on the sensor. When the sensor output is sent out as a notification, it is good to include information about the selection.
Now all that is needed is to apply the dating information into the selection.
SELECT COUNT( * ) FROM edidc INTO @rv_resultcounter
  WHERE direct = '1' AND status <> '03' and
        credat between @lr_dating-low and @lr_dating-high.
The KPI for the sensor will now select it's data based on parameter settings. This also means that the end user can place several sensors next to each other: one for today (
DATING:0), one for yesterday (DATING:1-1) and another one for the week before (DATING:7-2).Coding example
- Add a table with data to the sensor (optional)
Need to show details as a table ? Use
co_logmethods:add_subtitketo add a paragraph to the sensor loggingadd_tableheaderto compose a header line with column texts (;-separated)add_tablelineto compose a data-line (equally ;-separated)add_tablefooterto finish the table
Apply the following changes (replacing the select block):
"Selections - determine KPI
SELECT * FROM edidc INTO TABLE @data(lt_result)
  WHERE direct = '1' and status <> '03' and
        credat between @lr_dating-low and @lr_dating-high.

"Reporting on the selections.
co_log->add_subtitle( 'Overview of Idocs' ).
co_log->add_tableheader( 'Messagetype;Creation;Documentnumber' ).
loop at lt_result into data(ls_result).
  co_log->add_tableline( |{ ls_result-mestyp };~{ ls_result-credat date = user };| &&
    |{ ls_result-docnum }| ).
endloop.
co_log->add_tablefooter(  ).

rv_resultcounter = lines( lt_result ).
A few things happened here. The selection was adjusted to select actual data instead of a counter. The resulting table data is added to the sensor output with a subtitle, table header, table lines and a footer. And the KPI of the sensor type is set to the number of selected results.Coding example
- Add textual sensor settings to the sensor (optional)
For this step, some changes are done to the sensor logic first. Instead of listing individual Idocs, we are reporting in Idoc counters per message type. The new output will be Messagtype + Description + the number of Idocs.
SELECT EDIDC~mestyp, EDIMSGT~DESCRP, count( * ) as counter
  FROM EDIDC
  LEFT OUTER JOIN EDIMSGT on EDIMSGT~MESTYP = EDIDC~MESTYP and EDIMSGT~LANGUA = 'E'
  INTO TABLE @data(lt_result)
  WHERE EDIDC~direct = '1' and
        EDIDC~status <> '03' and
        EDIDC~credat between @lr_dating-low and @lr_dating-high
  GROUP BY EDIDC~mestyp, EDIMSGT~DESCRP.

"Reporting on the selections.
co_log->add_subtitle( 'Overview of message types' ).
co_log->add_tableheader( 'Messagetype;Description;Idocs' ).
loop at lt_result into data(ls_result).
  co_log->add_tableline( |{ ls_result-mestyp };{ ls_result-descrp };| &&
    |{ ls_result-counter NUMBER = USER }| ).
  rv_resultcounter = rv_resultcounter + ls_result-counter.
endloop.
co_log->add_tablefooter(  ).
Try this out, see how it looks. We are going to add text settings per message type, to assign a contact person to the report.
"The other" way to let the framework hold information for a sensor is the sensor long text. An
SO10text can be composed in any way you like and will be available. Long texts can be as long as you need and is linked to the sensor type. Sensor long text settings are applicable to the sensor type so if the sensor is implemented several times, the implementations all have the same sensor long text settings.To create settings, the sensor editor will present 2 buttons. One for editing and another one for a documentation popup on how it should be edited. The framework extracts the information from the sensor coding. This is done by checking whether the sensor logic calls method
zcl_sensor_manager=>get_longtext( ). The settings editor detects a call and will show the buttons on text settings for the respective sensor.The information that is used to compose the help-page is composed from Abap comment lines, also directly from the sensor logic. The key here is the comment notation:
*| Commentstypes: begin of lty_settings, mestyp type edidc-mestyp, contact type string, end of lty_settings. data lt_settings type sorted table of lty_settings with unique key mestyp. ... LOOP AT zcl_sensor_manager=>get_longtext( ) INTO DATA(lv_textline). *| The sensor text can be used to specify the message types for *| which a contact person is known. *| /: MATMAS *| * Peter Potter *| The contact person will be listed with the message type. IF lv_textline-tdformat = '/:'. INSERT VALUE #( mestyp = lv_textline-tdline ) INTO TABLE lt_settings ASSIGNING FIELD-SYMBOL(<ls_settings>). ELSE. <ls_settings>-contact = lv_textline-tdline. ENDIF. ENDLOOP.The call toget_longtext( )will trigger the text buttons on the settings editor. And when the sensor is executed, it will read the sensor longtext (in English only). The*| Commentswill be used for the button on explaining the text options. In this case, a table of message types with a contact name is composed. Note the use of/:in the longtext, as it is not mandatory to do it this way - but commonly used in the standard sensors. The coding logic composes a tableLT_SETTINGSwith the settings on the long text. These settings are then used/applied:"Reporting on the selections. co_log->add_subtitle( 'Overview of message types' ). co_log->add_tableheader( 'Messagetype;Description;Idocs' ). loop at lt_result into data(ls_result). co_log->add_tableline( |{ ls_result-mestyp };{ ls_result-description };| && |{ ls_result-counter NUMBER = USER }| ). if line_exists( lt_settings[ mestyp = ls_result-mestyp ] ). co_log->add_tableline( |Contact: { lt_settings[ mestyp = ls_result-mestyp ]-contact }| ). endif. rv_resultcounter = rv_resultcounter + ls_result-counter. endloop. co_log->add_tablefooter( ).The sensor results will now show additional information per message type - when it is available. Go to the sensor settings for this sensor type and add your name to a message type.Coding example
- Also worth mentioning
The main features are all covered in this step tutorial. A few additions - so you know this is also available:- The
DATINGparameter is available for dates, as is theTIMINGfor times. Use theZCL_SENSOR_MANAGER=>GET_TIMINGmethod for this. - Other parameters can be named whichever way you like. The standard sensors mostly use Y and N as indicators (e.g.
DETAILED:YorHIDE_WARNINGS:N. Use methodZCL_SENSOR_MANAGER=>GET_PARAMETERmethod for this. - The detailed content of a sensor is composed on changing parameter
CO_LOG. Note that there are moreADD_*methods available than demonstrated on this tutorial. TheADD_TABLENODATAfor example, which will test the table with results and add a "No data found" message to the overview. Check out the options and don't forget the standards sensor types can be used as usage examples. - When a sensor is called, the group from which the sensor is called is an unknown. The
ZCL_SENSOR_MANAGER=>gv_groupname_on_executionwill be available if a group reference is needed.
- The
Summary
A sensor type calledFrom a simple sensor that determines a KPI, to a sensor that
uses the DATING parameter to select more accurately. On to a sensor that lists results as a table, which is also available
as an ALV report - for end users. On to using the more elaborate sensor long text settings. Which can contain just about anything.
Parameters and sensor text settings
Sensors work with parameters and also host settings as text. Nearly all sensors use this setup and can be "parameterized". The most commonly used parameter settings control date and time:
- TIMING: the Timing parameter determines a start time and an end time to be applied on the current day.
TIMING:120means a start time of 2 hours ago and an end time of "now" or "the moment the sensor check logic is called. The sensor logic will use this for its selection logic. So no information older than 2 hours is selected/involved. TIMING:70-10 will start 70 minutes ago and end 10 minutes ago. Use method zcl_sensor_manager=>get_timing for this. - DATING: the dating parameter works like the de timing parameter, for dates.
DATING:8-1means everything for the past 7 days. zcl_sensor_manager=>get_dating. - Other parameters, use method zcl_sensor_manager=>get_parameter.
Using parameters can make the sensor specific for a company code or Idoc type. Sensors can be used for a specific group or purpose or subject, pinpointing problems. The sensor for batch job monitoring can now monitor that specific job that is relevant for a given group.
When using parameters, it is important to log what parameters were used and which value they had. This should be part
of the sensor details. In addition to that, the used parameters should be documented on method
zif_sensors~internationalize.
The Settings report will use this for F4 functionality on the sensor - which gives the user of the settings report the chance
to see what parameters are supported (and what they do).
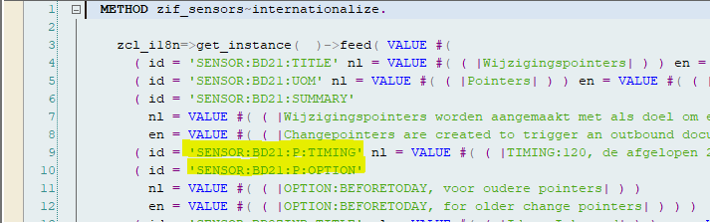
Example of 2 parameter definitions TIMING and OPTION.
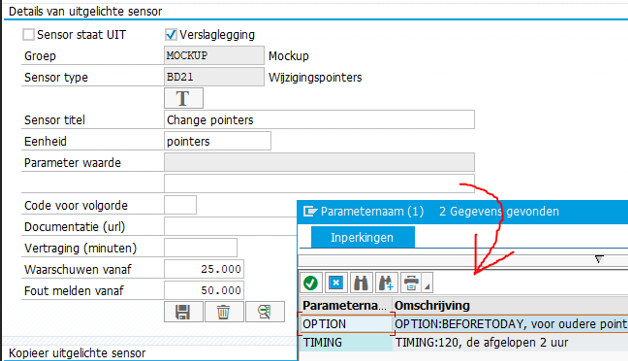
Click F4 on the Parameter value field to reveal available options.
Parameters as range variables
The all important SELECT-OPTIONS fields on Abap reports have been around for a long time and have proven it's
use. It can be used to let the SQL selection work with a very specific set of values. Including, excluding, values between or
values according to a pattern, multiple values, the lot. And the mechanism is not wasted here - sensors can use it.
Sensor type RANGES is where the range value content is defined. The sensor comes with a report ZSENSOR_REP_RANGES
on the available settings. Sensors with parameters that have the *-RV convention can work with it.
There are many sensor types using this concept. Press F4 on the parameter value field in se sensor editor and look for
parameter names with convention *-RV. Set up a range and apply for your sensors.
If you want to implement a range variabele on your own sensor, here's a step plan:
- Add a range definition to the
RANGESsensor type or select an already existing one to use. - Add 2 descriptions to your internationalization setup.
lo_i18n->feed( VALUE #( ( id = 'SPECIFIC:JOB' nl = |Selectie specifiek voor batchjob &| en = |Selection specific for batchjob &| ) ( id = 'batchjobs' nl = |achtergrond taken| en = |batch jobs| ) ... - Involve the range variables in your coding. In this example, the name parameter name will be
JOBNAMEandJOBNAME-RVwhich are commonly used as a pair.DATA(lr_jobname_rv) = zcl_sensors_sensorboard=>get_range( EXPORTING iv_parvalue = iv_parvalue iv_rangename = 'JOBNAME' iv_message = lo_i18n->get( 'SPECIFIC:JOB' ) iv_fieldlabel = lo_i18n->get( 'batchjobs' ) CHANGING co_log = co_log ). - Multiple range variables can be added here. The
CO_LOGsensor logging will be updated with relevant messages - that explain which range variable is used. - To wrap-up the sensor logging will need to show what settings have been applied. Once all main messages are
processed, perform this call:
  "Log the (all) used range variables as a table.
  zcl_sensors_sensorboard=>log_ranges( CHANGING co_log = co_log ).
- Variable
lr_jobname_rvis now available to be used in your sensor logic. As the range definition may be longer than required, it is possible to set values on theRANGESsensor that are too long for the actual selection. This will lead to a dump. Use the followingTRY-ENDTRYblock to avoid dumps:TRY. "Your selection, using lr_jobname_rv here CATCH cx_sy_open_sql_data_error. co_log->add_message( 'Range variabele error: value provided does not fit in field' ). rv_resultcounter = -1. EXIT. ENDTRY. - Now make sure the parameters are added to the
zif_sensors~internationalizemethod. Like so... ( id = 'SENSOR:SM37:P:JOBNAME' nl = |Inzet voor specifieke job, bijvoorbeeld JOBNAME:SAP_SLD_DATA_COLLECT of *_MC| en = |Use specifically for a given job, e.g. JOBNAME:SAP_SLD_DATA_COLLECT or *_MC| ) ( id = 'SENSOR:SM37:P:JOBNAME-RV' nl = |I18N:range-variable| en = |I18N:range-variable| ) ...
Sensor text settings
For sensors that require more setting information that can be captured in (uppercased) parameters, the sensor settings text can be used. This is a standard SO10 long text that is made available in sensor logic itself and it can contain anything the sensor requires. Use zcl_sensor_manager=>get_longtext to fetch this text. Like with parameter settings, it is good practice to document the settings on the sensor itself. As example a sensor settings text on AL11 folders is shown, where for a folder (or any unique code) settings are available.
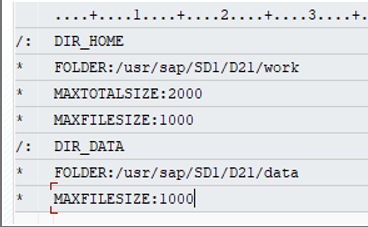
Example of a sensor settings text - for the FILES sensor.
This information is grouped per ID, a freely assignable (but uppercased) code. For the example these codes are also
used in AL11. Furthermore in this example there are several parameter settings for each ID, FOLDER, MAXTOTALSIZE and
MAXFILESIZE can be set up to supply the sensor with details on determining a KPI. On this example, the KPI is the
number of issues found.
The sensor should be set up to show the settings from the setting text, for the above example this shows as:
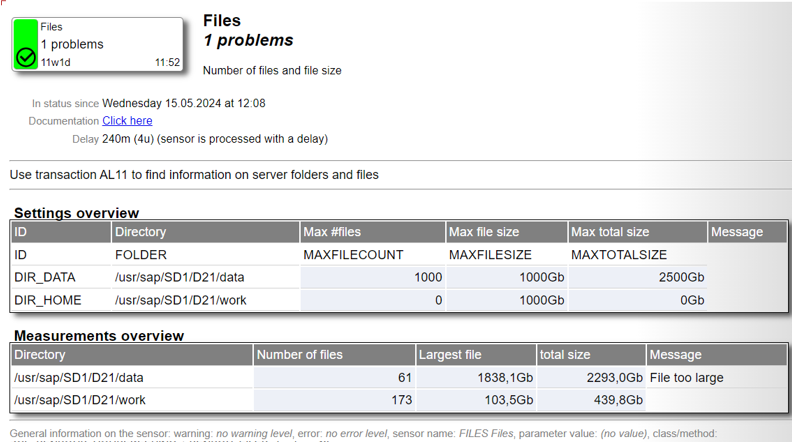
Example output for the FILES sensor - settings are shown as table.
The sensor settings text can be edited in the Settings application (report). Note that the report has a button for the "Example settings text" which is linked to a special coding block on the sensor logic. Consider the example below:
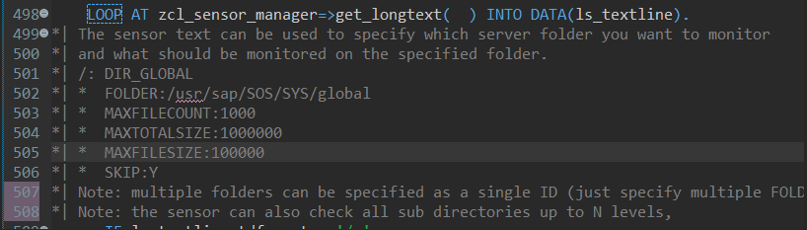
Coding snippet from the FILES sensor.
Which will show as:
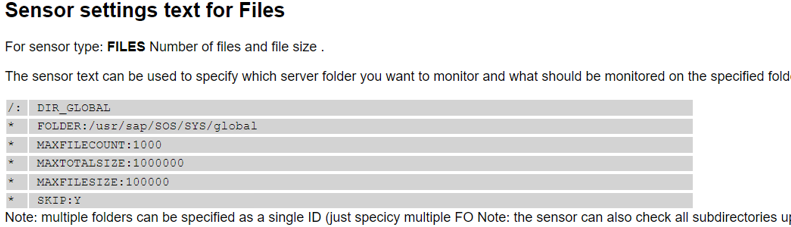
Popup from the Settings application - button "Example settings text".
One additional remark on the use of parameters and the sensor settings text. Alternate parameters is the way to
differentiate sensors in sensor logic. This means a parameter for a company code will make the sensor logic do
something specific company code selection. The settings text is one and the same text for all sensors of the same
type. Combine parameters with settings text content if you need to work with multiple parameters. The system has
several examples where this is done, like the above FILES sensor.
Consider using the SKIP parameter when the same sensor type is used multiple times. There are
several examples available for this (like the above FILES example). The idea behind SKIP is as follows: the sensor
longtext is in fact a sensor-type longtext, which is applicable to all sensors of the same type. Using SKIP is
the way to inform the sensor that the settings should be ignored for sensors without parameters. Why ? Because
a sensor with a parameter specific for these settings will be available. In the above screen-print example:
a sensor with parameter FOLDER:DIR_GLOBAL will use the presented settings. The sensor without parameters will
ignore these settings (and list all settings without SKIP parameter). Now multiple sensors on the same subject
can be aligned to each report their own focus area.
The Zone - components documentation
Article with free download referencesAbapDoc documentation is gradually becoming a more popular way to document coded components. The sensorboard framework is a fully AbapDoc documented framework, which will show when using Eclipse (with F2 for example).
The Zone is a report that focusses on custom build components - as a webpage about re-usable components. The sensorboard framework is added to the Zone report in 2 parts:
- Using the framework - with the components that are needed to add your own sensors to the Board
- The framework itself - with all components of the complete framework. This could be useful when assessing the coded setup (security mainly).
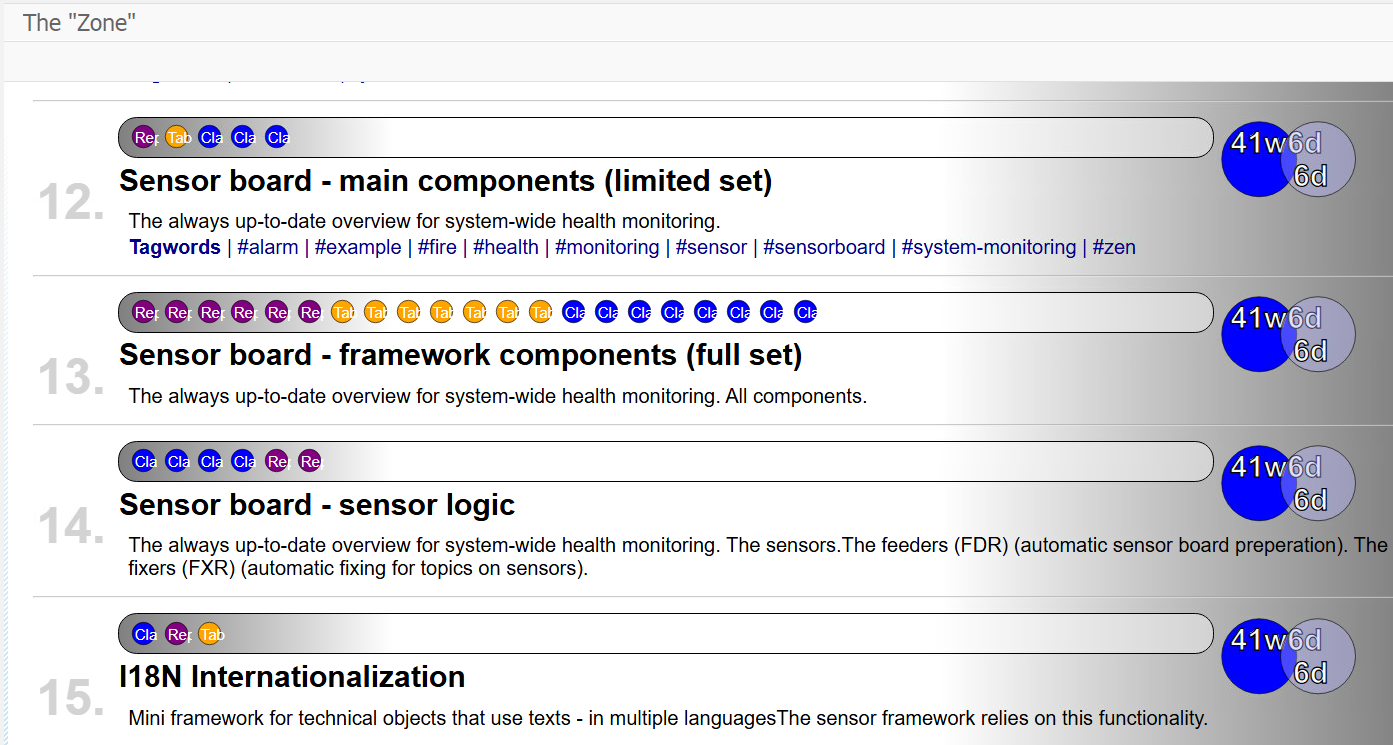
Subjects as listed on the Zone report
The actual content of the conponents that are listed are editable for developers (through include ZONE_SCRIPT.
The Zone can be an effective way to share re-usable components with the other developers. Not only does it list them, it explains what is there and with a bit of AbapDoc documentation - developers can help developers. After all: a re-usable component that is unknown to others is less-likely to be re-used.
Get your own copy here. It's just a report (with menu and screen) and an include. As developer - you should be just fine applying this to your system.
- Download: Zone report
The main program
- Download: Screen 900
Screen 900 for the main program (use transaction
SE51or double click from the abap sourcecode). - Download: menu
Menu for the main program (use transaction
SE41or double click from the abap sourcecode). - Download: Zone script include
The script include (create as include).
Internationalization
Article with free download referencesThe full application is set up in 2 languages, for which the I18N (Internationalization) mini-framework was used. The framework caters for setting up language elements (texts) in the language of your choice by hard-coding them into the Abap logic. All applications and all standard sensors were set up in Dutch (nl) and English (en).
The big advantage of embedding text elements into coding is making it easy to apply the coding on multiple
systems (without the need for a transport mechanism). The A class with sensors is effectively a single file
with class definition, methods for it's sensors and text elements within the methods.
If it's the introduction text for sensors you are addressing - this is may be good to know:
Every sensor can have additional documentation set up through sensor longtext settings, using the
This does not involve internationalization but should be seen as an easy to implement
alternative. Just try this:
The intro-text on sensors
INFO parameter.
This should now show something like this:
INFO
	/: INFO
	*  This is where some additional documentation is shown
Now refresh and display the sensor - your new text should be shown on the sensor.
Change existing texts
If the text that is displayed on a standard sensor does not explain the issue enough, the text can be overwritten
through the I18N framework. All you would need to do is find out what textpool the sensor is using (this would
typically be sensor.st22 for sensor type ST22) and add your text to the textpool table.
In steps:
- Determine which textpool to use for your changes (
sensor.st22). - Determine which text you want to change (
INFOholds the introduction text for the sensor). - Run report
ZI18N_EDITORand fill in the textpool and text. Focus on the text. - Initially nothing will be found - as the text is available as hardcoded only. From the editor, create the text.
- Supply the new text and save.
- When the sensor is displayed, the hardcoded texts will be ignored and the newly supplied texts will be used.
- Note that the
ZI18N_EDITORapplication supports NL, EN, DE, IT, FR and ES. - Note that the editor also hosts download and upload functionality (as JSON).
Get your own copy here. It's just a report, a class and a table.
- Download: ZCL_I18N class
The framework class.
- Download: Zi18n_editor report
The editor for i18n settings. Also doubles as example report on how to use the framework.
- Download: ztextpool_i18n table
The definition of the textpool(s) table.
Adding other languages
To make the application available in other languages, the framework only needs it's textpool table to be filled. All applications (and sensors) will recognise which language to use from the user logon language, so when e.g. the Italian version is available it will be used.
Like the Rosetta stone in report ZI18N_EDITOR, the text for the following languages
are shown in a single screen editor: NL, EN, DE, IT, FR and ES.
Check the versions overview for available translations. At the time of writing there are only 2 languages available. If and when other languages are supported, this will be implemented through a textpool which can also be made available to you.
Framework components
The mini framework for internationalization is not specific for the sensorboard. It consists of:
- Class
ZCL_I18N - Table
ZTEXTPOOL_I18N - Report
ZI18N_EDITOR
The usage of the framework is demonstrated in it's own editor. An instance of the ZCL_I18N is
created, preferrably with a pool (iv_pool). The language ID's that are needed are then
added to the instance of ZCL_I18N using method FEED (single text lines) or
MULTIFEED (multiple text lines). It is also possible to work
with the elements that are stored on the textpool table.
Whenever a text is required in the Abap coding, the get method will provide it. Texts with &-characters
can be used with (up to 3) parameters.
There are also options with e.g. the plural forms of text (texts) like Apple and Apples. And texts consisting of
multiple lines are also supported. Note that the editor only handles up to 3 lines. JSON upload and download or
calls to FEED have no limit to the number of lines processed.
In some cases it may be useful to use the texts from multiple text pools. This can be done with FEED, consider
the example:
	* Create a text container with the texts on textpool 'sensor.general'
	data(lo_i18n) = zcl_i18n=>get_instance( 'sensor.general' ).
	* Now feed it with the texts from another pool
	lo_i18n->multifeed( zcl_i18n=>get_instance( 'sensor.specific' )->gt_texts ).
	lo_i18n->multifeed( zcl_i18n=>get_instance( 'sensor.evenmore' )->gt_texts ).
This will only work with the texts that are stored in the textpool table. If the textpools involved share a text ID, then the ID that was first available will be used.
Dutch (nl)
English (en)
French (fr)
Italian (it)
German (de)
Spanish (es)
oData sensor services
Sensorboards can be displayed just about anywhere, through 2 services.
- The board - groups with all their sensors
- Single sensor execution - where a sensor is executed and the latest details are returned.
Overview of available technical objects for this:
- Root custom entity
Z_Sensorshipwith custom entityZ_Sensorship_Sensor - Root custom entity
Z_Sensorship_Sensor_Singlewith custom entityZ_Sensorship_Sensor_Report - Implemented by class
ZCL_SENSOR_MANAGER_RAP.
@EndUserText.label: 'Sensorboard RAP services'
define service Z_sensorship {
  expose Z_Sensorship               as SensorBoard;
  expose Z_Sensorship_Sensor        as Sensor;
  expose Z_Sensorship_Sensor_Single as SingleSensor;
  expose Z_Sensorship_Sensor_Report as SingleSensorContent;
}
(1) Get the (full) board with groups and sensors
As example call to get an overview of the sensorboard sensors:
https://xxxxxx.dev.xxxx.nl:8020/sap/opu/odata4/sap/z_sensorship/srvd_a2x
/sap/z_sensorship/0001/SensorBoard('NL')
/Set?$select=GroupName,Title&$expand=_Sensors($select=KPI,UoM,Title,Status)
Would produce a list of the (all) available sensors. Like so:
{
  "@odata.context" : "../$metadata#SensorBoard('NL')/Set(GroupName,Title, _Sensors(KPI,UoM,Title,Status,Sensor,ParameterValue))",
  "@odata.metadataEtag" : "W/\"20250317171116\"",
  "value" : [
    {
      "GroupName" : "CONSISTENCY",
      "Title" : "Data consistentie",
      "_Sensors" : [
        {
          "Sensor" : "BUT0ID",
          "ParameterValue" : "",
          "Status" : "",
          "KPI" : 53,
          "UoM" : "duplicaten",
          "Title" : "NXR duplicaten"
        },
        {
          "Sensor" : "BUT0ID",
          "ParameterValue" : "RELATION:Z00025",
          "Status" : "",
          "KPI" : 0,
          "UoM" : "duplicaten",
          "Title" : "CloudID duplicaten"
        },
		....
Note that this call returns only a small subset of the available data, as the $select was used
to specify requested fields.
Also note that filtering is available for the relevant fields (GroupName, Priority, UserIsSubscribed, Sensor,
ParameterValue, Status and LogChangedRecently).
(1) Execute a single sensor and get the details
https://xxxxxx.dev.xxxxx:44302/sap/opu/odata4
  /sap/z_sensorship/srvd_a2x/sap/z_sensorship/0001
  /SingleSensor(p_groupname='SYSTEMHEALTH',p_sensor='ST22',
  p_parametervalue='',p_language='NL')/Set
  ?$expand=_Report
Which would present something very similar to
{
  "@odata.context" : "../$metadata#SingleSensor(p_groupname='SYSTEMHEALTH',
    p_sensor='ST22',p_parametervalue='',p_language='NL')/Set(_Report())",
  "@odata.metadataEtag" : "W/\"20250317171116\"",
  "value" : [
    {
      "GroupName" : "SYSTEMHEALTH",
      "Sensor" : "ST22",
      "ParameterValue" : "",
      "Status" : "",
      "KPI" : 7,
      "UoM" : "dumps",
      "Title" : "Dumps",
      "MeasurementDate" : "2025-03-31",
      "MeasurementTime" : "22:12:41",
      "StatusDate" : "2025-01-26",
      "StatusTime" : "12:44:00",
      "SequenceOnBoard" : "0410",
      "DocumentationLink" : "",
      "WarningLimit" : 0,
      "ErrorLimit" : 0,
      "CreatedByBapi" : "",
      "TrackHistory" : "",
      "Delay" : 0,
      "LogId" : 22,
      "_Report" : [
        {
          "LineNumber" : 0,
          "lineType" : "LABEL",
          "Content" : "In status sinds: Zondag 26.01.2025 om 12:44"
        },
        {
          "LineNumber" : 1,
          "lineType" : "HISTORY",
          "Content" : "22"
        },
        {
          "LineNumber" : 2,
          "lineType" : "INFO",
          "Content" : "Dumps kunnen worden getoond via transactie ST22. Deze sensor werkt met een white list"
        },
        {
          "LineNumber" : 3,
          "lineType" : "INFO",
          "Content" : "en een black list waarin specifieke dumps kunnen worden aangegeven."
        },
        {
          "LineNumber" : 4,
          "lineType" : "INFO",
          "Content" : ""
        },
        {
          "LineNumber" : 5,
          "lineType" : "INFO",
          "Content" : "De white list is voor runtime fouten die (door de sensor) genegeerd kunnen worden. Black list dumps zijn"
        },
        {
          "LineNumber" : 6,
          "lineType" : "INFO",
          "Content" : "juist heel belangerijk, omdat ze bijvoorbeeld over memory gaan."
        },
        {
          "LineNumber" : 7,
          "lineType" : "INFO",
          "Content" : "Deze sensor is voorzien van een whitelist (niet tonen) en blacklist (met prioriteit tonen)"
        },
        {
          "LineNumber" : 8,
          "lineType" : "INFO",
          "Content" : "dump selectie die is opgenomen in de sensor-tekst."
        },
        {
          "LineNumber" : 9,
          "lineType" : "MESSAGE",
          "Content" : "Er zijn 3 white-listed en 14 black-listed dump codes."
        },
        {
          "LineNumber" : 10,
          "lineType" : "MESSAGE",
          "Content" : "Dumps selectie (zonder lock) van vandaag"
        },
        {
          "LineNumber" : 11,
          "lineType" : "SUBTITLE",
          "Content" : "Overzicht per gebruiker"
        },
        {
          "LineNumber" : 12,
          "lineType" : "TABLEHDR",
          "Content" : "Telling;Gebruiker;Dialoog gebruiker"
        },
        {
          "LineNumber" : 13,
          "lineType" : "TABLELINE",
          "Content" : "4;~G009154;Ja"
        },
        {
          "LineNumber" : 14,
          "lineType" : "TABLEEND",
          "Content" : ""
        },
        {
          "LineNumber" : 15,
          "lineType" : "SUBTITLE",
          "Content" : "Overzicht van de dumps"
        },
        {
          "LineNumber" : 16,
          "lineType" : "TABLEHDR",
          "Content" : "Telling;Mandant;Dump;Prioriteit"
        },
        {
          "LineNumber" : 17,
          "lineType" : "TABLELINE",
          "Content" : "2;~120;OBJECTS_OBJREF_NOT_ASSIGNED_NO;"
        },
        {
          "LineNumber" : 18,
          "lineType" : "TABLELINE",
          "Content" : "4;~120;SAPSQL_DATA_LOSS;"
        },
        {
          "LineNumber" : 19,
          "lineType" : "TABLELINE",
          "Content" : "1;~120;SYNTAX_ERROR;"
        },
        {
          "LineNumber" : 20,
          "lineType" : "TABLEEND",
          "Content" : ""
        },
        {
          "LineNumber" : 21,
          "lineType" : "MESSAGE",
          "Content" : "Er zijn 3 dumps onderdrukt (wegens whitelist en/of blacklist met prioriteit)"
        },
        {
          "LineNumber" : 22,
          "lineType" : "SUMMARY",
          "Content" : "<hr>"
        },
        {
          "LineNumber" : 23,
          "lineType" : "SUMMARY",
          "Content" : "<section class=footer>"
        },
        {
          "LineNumber" : 24,
          "lineType" : "SUMMARY",
          "Content" : "Algemene informatie over de sensor:"
        },
        {
          "LineNumber" : 25,
          "lineType" : "SUMMARY",
          "Content" : "waarschuwing: <i>geen waarschuwingslimiet</i>,"
        },
        {
          "LineNumber" : 26,
          "lineType" : "SUMMARY",
          "Content" : "fout: <i>geen foutenlimiet</i>,"
        },
        {
          "LineNumber" : 27,
          "lineType" : "SUMMARY",
          "Content" : "sensor naam: <i>ST22 Dumps</i>,"
        },
        {
          "LineNumber" : 28,
          "lineType" : "SUMMARY",
          "Content" : "parameter waarde: <i>(geen waarde)</i>,"
        },
        {
          "LineNumber" : 29,
          "lineType" : "SUMMARY",
          "Content" : "class/methode: <i>ZCL_SENSORS_STANDARD=>SENSOR_ST22</i>,"
        },
        {
          "LineNumber" : 30,
          "lineType" : "SUMMARY",
          "Content" : "duur: <i>46ms</i>."
        },
        {
          "LineNumber" : 31,
          "lineType" : "SUMMARY",
          "Content" : "</section>"
        }
      ]
    }
  ]
}
The important thing to note here is that the sensor was executed and its renewed KPI results were logged on the
ZSENSORS table. In theory (though not very practical) some external system could control when sensors
are executed (and thus updated) - using this very RAP service.
What about the details (LineType)
Each sensor is a report that was composed for the sensor. Some reveal very little information, others hold a table
with the used settings and another table with detailed information in up to 9 columns. The information is made available
in association _Report which is composed of a series of components or lines. Each component has a LineNumber
and a LineType. Make sure they are processed in the LineNumber sequence.
An overview of the line types (LineType) and their meaning:
- TITLE
The title of the sensor.
Template: |<h2>{ content }</h2>|
- SUBTITLE
The subtitle of the sensor.
Template: |<h3>{ content }</h3>|
- INFO
Sensor general information, explaining what the sensor does and what tools are available to follow up.
Template: |not applicable|
- BUBBLE
Can be ignored.
Template: |not applicable|
- MESSAGE
Show a bulleted message.
Template: |<br><b>o</b> { content }|
- LABEL
Show a labeled field, with field name and field value (separated by a :).
Template: |<table><tr><td style="width:80px;"></td><td class=fieldlabel>{ field }</td><td>{ value }</td></tr></table>|
- LINKLABEL
Show a labeled field, with field name and field value (separated by a :). The field value is an Url.
Template: |<table><tr><td style="width:80px;"></td><td class=fieldlabel>{ field }</td>|
<td><a href={ value } target = new>{ value }</a></td></tr></table> - TABLEHDR
A table header line, with column names. A list of names separated by a ;
Template: |<table><tr><td>{ column1 }</td><td>{ column2 }<td></tr></table>|
- TABLELINE
A table header line, with column values. A list of values separated by a ;
Note that numeric fields can be displayed as character fields by preceding the value with ~.
Note that a table line without column separators (;) will occupy the whole line (colspan=10).Template: |<table><tr><td>{ value1 }</td><td>{ value2 }<td></tr></table>|
- TABLEEND
End the table (mandatory).
Template: |</table>|
Advanced topics
Logging sensor KPIs
Logging the KPI results of each sensor can be switched on (and off) any time. The logging results are held on table
ZSENSORLOGS. Note that the log is designed to capture deviations only, thus when a KPI value is stable the framework
will only adjust the end date and end time on the log.
When logging information is available, it will be presented as SVG graphics on the sensor tile information. It can
also be viewed on the sensor settings application, as ALV report. Note that the logging details are shown up to T-30
days (up to 30 days ago). There is also a T-90 days overview. Keeping records older than 90 days is only relevant if
the ALV report from sensor settings is used (or if the sensor log table itself is used). Housekeeping on logs can be
done in the ZSENSORS_ENGINE report. This will effect logs from all sensors.
Detailed sensor logging
The sensorboard also hosts a more elaborate logging feature: the detailed log. This logs everything from a given measurement. Detailed logs should not be composed too often, but they can be composed ad-hoc at any moment. Ad-hoc logging can be done for any sensor, directly from the Sensorboard by selecting CTRL-Click on the required sensor. This logging is done even if logging is not switched on on the sensor. Functionality is also available from the sensor settings application or from the sensor detailed comparison report. Sensors can also be flagged for "Detailed logging" on the sensor settings. This should be arranged in combination with tne sensor engine background report. The job frequency and timing determine when sensor-detail-snapshots will be captured.
The sensor comparison report is available directly from the ZEN transaction and also from the sensor settings
application. Start the report, select a record and select "Compare". The selected record will be compared with a
fresh run of the sensor. It is also possible to select 2 lines with historic detail and compare them with each other.
External sensorboards
1. Disclose sensor logic to an external sensorboard
The whole concept of the sensorboard originates from network sensorboards. When systems need to be monitored a
network sensorboard can be used to monitor whether systems are active and responsive. The sensorboard system would
be a system on it's own and not part of the system it's monitoring. With a single service (to be added to the
system) the sensors that are created on this board can be disclosed to an external board. This would take the sensor
board setup to higher level, also involving other systems.
2. A sensor on another board
The sensorboard is all about what is happening on a system. But what if there are multiple systems in your landscape ?
Sensor REMOTE can report on the errors from the Sensorboard setup of another system. All that would be required for that
is an active RFC destination. From one of the boards, other boards can be monitored.
3. The full sensorboard as oData services
The groups and sensors on the board can also be disclosed as oData service definition to SAP gateway. A RAP service
is readily available for this purpose (separate paragraph on "oData sensorboard".
Generate groups and sensors (bapi)
Some (functional) sensors can be required for functional objects such as a sales organization or maybe a project.
And these objects may also have a life-cycle, e.g. projects that are no longer active will no longer require a sensor.
A separate report can be set up with the task of composing a list of required sensors. And also composing a list of
no longer required sensors. ZCL_SENSOR_MANAGER=>BAPI_GROUP and ZCL_SENSOR_MANAGER=>BAPI_SENSOR are available for
this task. This enables the sensorboard to automatically stay up to date on the actual sensors on the board.
Each of which will provide up-to-date KPI's.
Example: top 10 customers
Consider this usage-example: an analytical index sensor is in place, which compares the value of sales orders created over the past 10 days to the total value of sales orders from the period of 10 days that superceded. Thus 20 days of order value information to create an AEX-index like result "+6.355 %".
The details on this sensor report a bit more in-depth data, showing the values per customer.
A batch job is created (according to the ZSENSORS_BOARD_FEEDER example report) which will run the above sensor and
derives the top 10 customers with the highest order values for the last period. The batch job will remove the sensors
that were created in previous runs and add the new top-ten list to the board. As this is done only once a day, the
sensor framework will start executing these sensors.
The result is that the main sensor will report overall turnover progress, where the 10 sensors next to the main sensor reveals the focus on the largest customers.
Note that sensors that were created by Bapi are flagged as such. Visible in the Sensor editor.
Sensor follow-up / automatic fixes (bapi)
Where a sensor is aimed at getting details on problems, these details can also be used to fix the problems in
some automated way. Thus when a sensor reports on an issue on an order, the issue could be resolved with an order
change. The framework does more than just report on the problem. It can also make the list of problems available
through a BAPI: ZCL_SENSOR_MANAGER=>BAPI_EXECUTE_SENSOR will execute the sensor, compose the list of errors/issues and
update the system with the newly acquired KPI results. The BAPI will also make sensor details available through it's
return parameters. Parameter ET_DETAILS contains a table with sensor content elements, which can be used to find
reported details. Parameters ET_ALV_HEADER and ET_ALV_DATA contain a table with column headers and actual data from
the sensor. Use report ZSENSORS_REPORTER to view this data. It is extracted from the last (and main) sensor results
table.
The information from the BAPI can then be used as a work-list for automatic fixes. Once the fix is applied, the sensor's next run will (should) detect it's effects, which concludes the auto-fix cycle.
The standard sensor types sometimes come with a fixer report that can automatically resolve issues (often
by deleting data that has gone past it's retention period). Fixer reports have a naming convention ZSENSOR_FXR_{sensortype}.
Feel free to apply this naming convention on your own fixer reports.
The sensor alias
The design of a sensor and it's sensor text settings is not ideal for sensor types that have sensor-specific settings.
The setup is that a parameter-string can be set for a sensor - to control deviating behaviour. These parameters are
limited in size and are always uppercased. For the SQL sensor, the long text is used to describe the
selection the sensor should perform. As the sensor can be applied multiple times, sensor parameters are used to select
which text-set should be used.
Class ZCL_SENSORS_ALIAS is available to make 4 sensor types available as alias. They work exactly like
their originals, but they have "their own" sensor long text settings. As standard (but also as example) an alias sensor
is available for SM37 batch jobs, TABLES Tables, SQL SQL selections and SQLINDX
SQL Index - as these are the common candidates for an alias.
Use the ZCL_SENSORS_ALIAS class as example if you need more aliasses. The naming convention for these is
_2, _3 and so on.
Sensorboard CSS settings
The sensorboard is composed with an HTML page for which CSS styling was used. The tiles for each sensor have lines, a shadow, text sizes, colors and many more very customizable settings. To make changes possible, CSS script changes can be applied to the HTML template for the sensorboard. It was already possible to set a background image and it is also possible to apply other CSS related changes.
To determine what additions to apply, a web browser with a sensorboard as HTML in it should be available. As this is not available from a SAPGUI session (the "browser" as it is displayed in SAPGUI a very limited version comparing to Explorer or Chrome), a trick needs to me done to create a stand-alone HTML sensorboard. Here's how:
- Run the sensorboard.
- Type
MOCKUPin the command box. This will trigger some hidden functionality. - The full sensorboard content will be made available on the Windows clipboard (Ctrl-C/Ctrl-V).
- Create a new Notepad file and paste the clipboard content in there. Save as a .html file.
To apply your settings, the SENSOR self service sensor text setting need to be changed. Just add a
block to the settings, as per example:
/: CSS
*  table.sensor tr td.since { font-size:8pt;color:gray; }
The example settings will make the "12u34m" texts on the sensor tile less prominent (smaller and lighter colored).
The system will involve your settings on the sensorboard, without changing any abap coding or risking damaging the board output (which has been a delecate part of the solution).
Sensor checking in overdrive
The sensor engine architecture does not lock a program run, but it does lock a sensor check. This means that even if the sensor engine is scheduled to run every minute and the job would be scheduled three times (simultaneously), sensors would be updated very regularly and the framework would run super fast. At a heartbeat rate of 3 times per minute.
To make this a bit more practical, a heart-beat sensor engine job could be scheduled every 3 minutes. A secondary heart-beat sensor engine job could be scheduled every minute, to operate only on a predefined set of "high-priority" groups (specified on the sensor engine selection screen). One could even consider scheduling jobs with multiple steps, to make the engine perform multiple check runs per minute.
If there is a need for this speed - the architecture will support it.