- Welcome
-
-
Versions
-
- Sensor controls
-
-
General settings -
Sensor parameters -
Sensor long text
-
- Types of sensors
-
-
Performance -
Logs -
Batch jobs -
Hana cockpit -
Open SQL selection -
Queues -
Runtime errors -
Save space -
Locks and updates -
Idocs -
Users -
Email -
Workflow -
Printing -
Number ranges -
Tables -
Files and folders -
House keeping -
Transports -
Self service
-
Welcome to the Sensorboard
You've found the manual for the Sensorboard - home of sensors that keep an eye on details of your S/4 Hana system. This manual covers the individual sensors that are available on the board.
Welkom op het Sensorbord
Je hebt de handleiding gevonden bij een Nederlands- en Engelstalig sensorbord, thuishaven voor sensoren die een oogje in het zeil voor je houden voor het S/4 Hana systeem. De handleiding is alleen in het Engels beschikbaar. Deze handleiding behandeld de individuele sensoren op het bord.
Overview of groups for sensor types
The Sensorboard is a product that was designed and developed in Abap on S/4 Hana. The actual board is shown
in a SAPGUI screen as HTML (CSS, JavaScript) document. The board refreshes automatically. Details from the board
are also available as a service (oData) - which can be used to project the board content just about anywhere.
The sensorboard is displayed as an HTML page for which an example is shown below. Note that the below example does not respond to clicks where the real sensorboard (in SAP HANA) does. Interactive preview of a sensorboard with it's sensors.
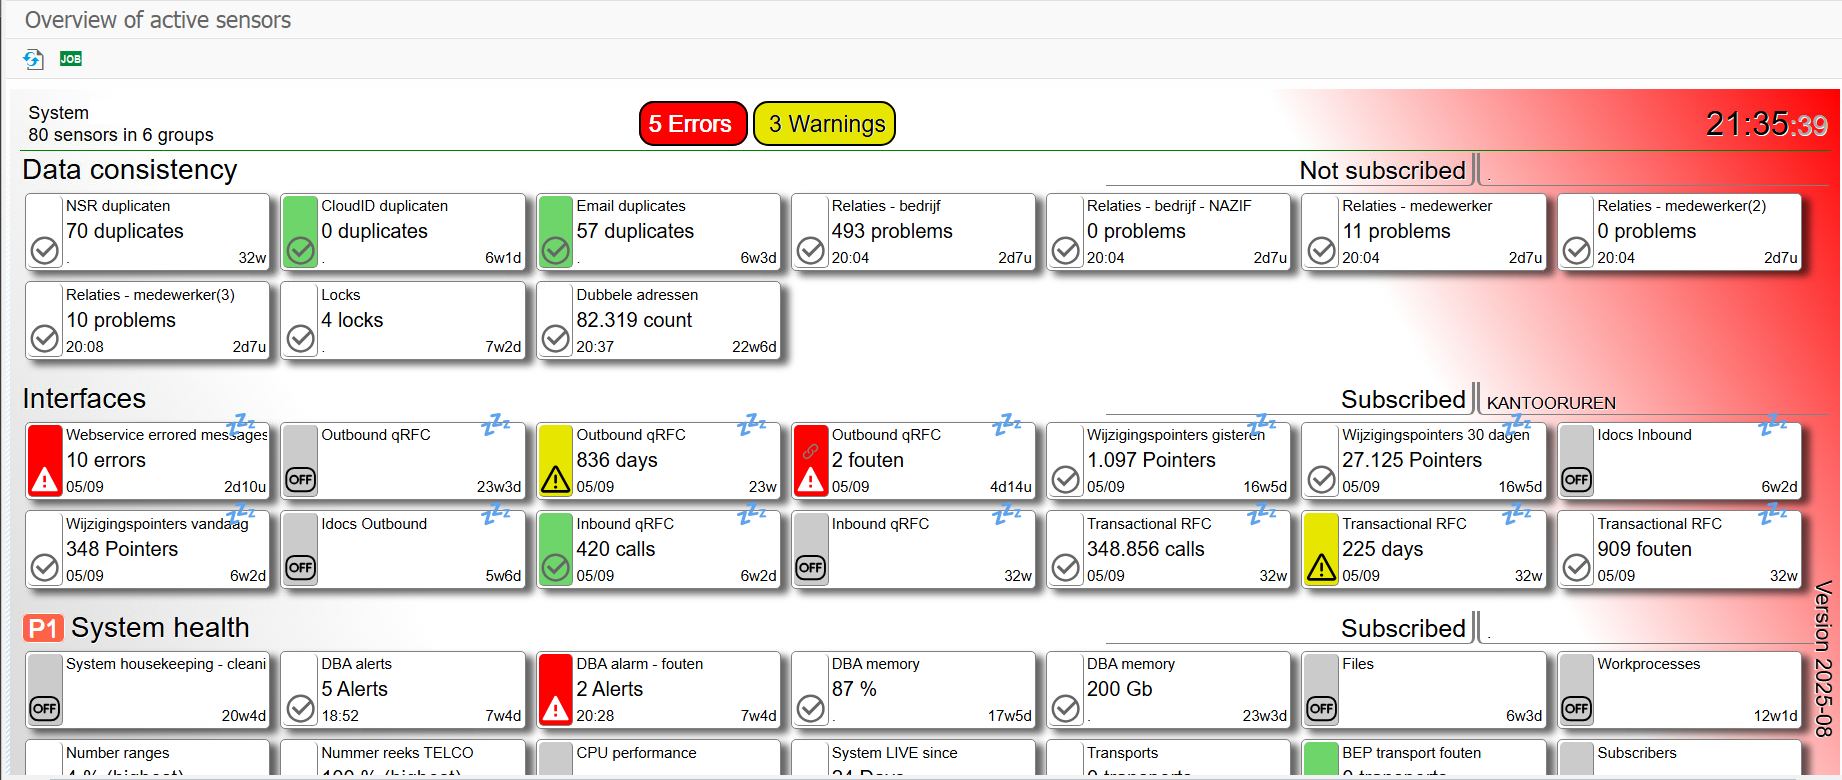 Preview of the sensorboard with errors and warnings
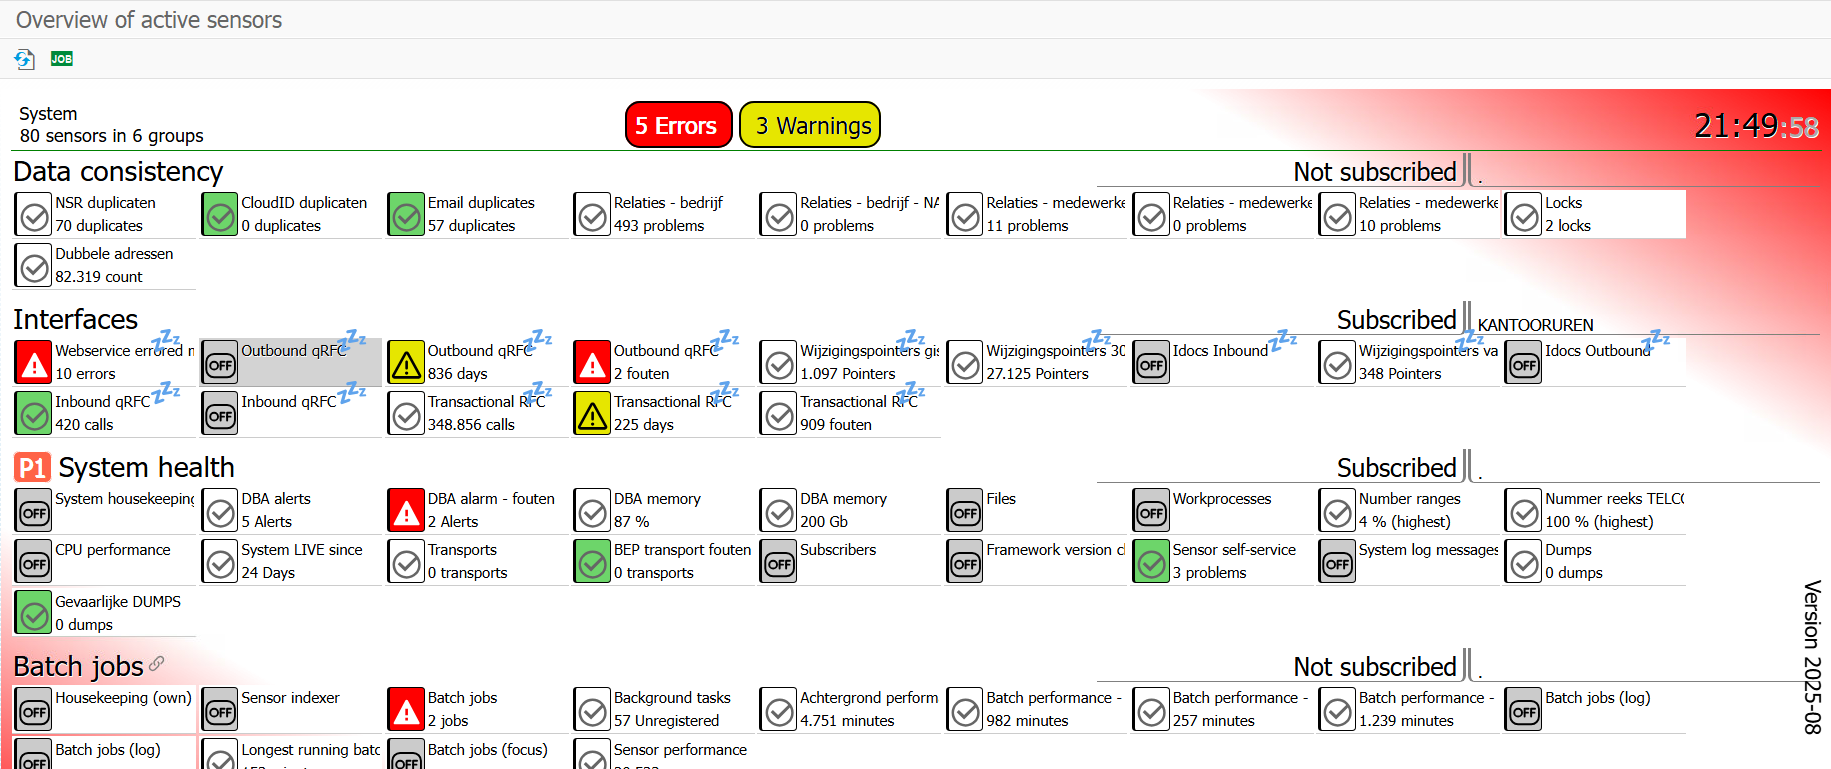 Preview of the sensorboard with compact tiles
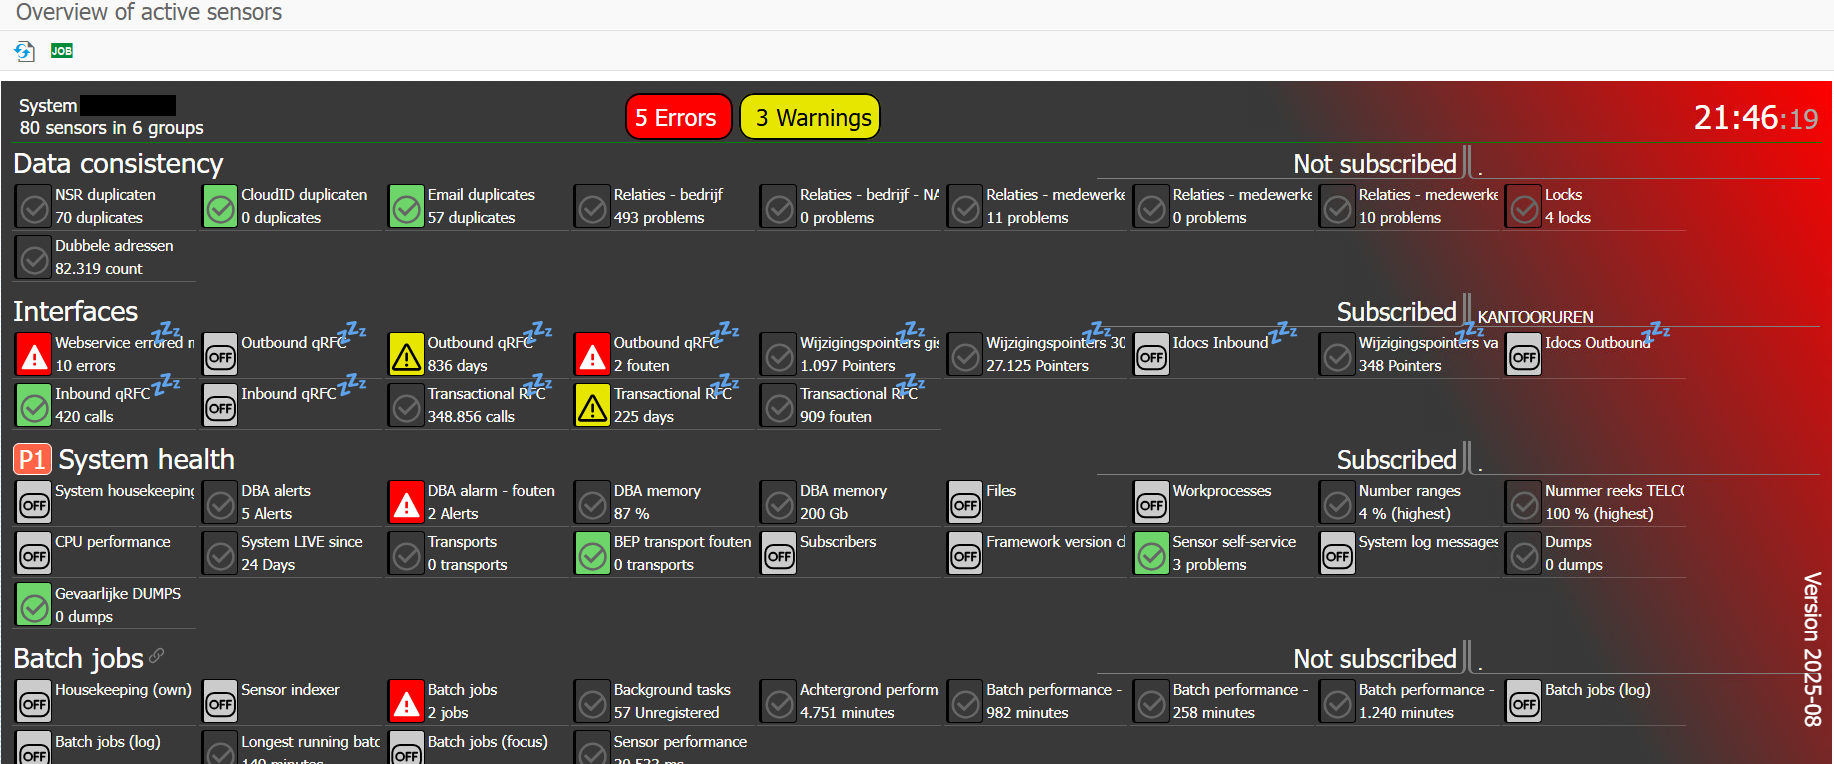 Preview of the sensorboard with compact tiles - dark mode
De gehele applicatie is beschikbaar in het Nederlands (en tegelijkertijd in het Engels).
The complete application is available in English (and simultaneously in Dutch).
Documentation is only available in English.
Sensors explained
The sensorboard is fitted with over 50 sensor types, all documented here.
Access
This documentation is accessible directly from the sensors.
Manual about sensorboard
This is the manual for the sensor types on the board.
There's also a manual describing the sensorboard framework.
Types of sensors
Each sensor on the sensorboard is in fact an implementation of a Sensor type. Some of the sensor types are very specific to a subject and some could be applied to e.g. a company code (of which there may be many).
When a sensor is added to the board, a group needs to be selected. It is not possible to add a sensor with the same sensor type and the same parameter settings to a group. Here's the rule:
Sensor = Sensor type + ParametersIn the paragraphs below all sensor types that are available as standard are briefly explained. Sensor types that share main subject are grouped together.
Batch jobs
Batch jobs cover an important and continuous workload of tasks that need to be done. Keeping a close eye on batch jobs is good sensor-ship.
Types of issues on batch jobs
- Batch jobs can be cancelled for several reasons. A job can "cancel itself" by throwing an error message. Jobs can also be cancelled because of a programming error resulting in a dump (ST22).
- It is also possible to cancel a job manually, e.g. when it is running too long.
- Jobs can run too long.
- Jobs can produce logs about problems that don't stop the job. So there is an issue to be noted, but the job status doesn't reveal this.
Transaction SM37 will show details on batch jobs, from where all available batch job information is accessible.
Quick guide to the batch job sensors
As batch jobs are a quite prominent system feature, it comes with a variety of sensor types. Each of these types focus on a different feature. A short guide to help you out:
| Summary | Applicable to | KPI | Sensor type |
| Is my job running as expected? Checks runtimes and/or downtimes |
Single jobs | Number of issues on the batch job | SM37SINGLE |
| Is my job issuing a specific message Checks the batch job log for messages |
Single jobs | Number of jobs (job runs) | SM37LOGS |
| What jobs have been cancelled ? | All jobs Can be made specific |
Number of batch jobs | SM37 |
| Batch jobs overview. Batch job step overview Report (with register) on all periodic batch jobs |
All jobs | Number of unregistered jobs or the number of warnings | SM37ALL |
| What are out combined jobs consuming ? | All jobs For 1 hour |
Minutes of consumed processing time | SM37CPU |
| How long has the longest job been running ? | All jobs | Minutes of consumed processing time | SM37LONGEST |
Batch job sensor types
- SM37 Batch jobs
This sensor focusses on failing jobs. The simplest form is the total number of failed jobs on the current day. The sensor works with theTIMINGandDATINGparameters, which control how long the sensor should look back.The sensor can also be set up to focus on a specific job. Parameter
NAMEcan be used to specify the focussed job. This can be used to compose a group specific for a process. The SM37 sensor can be set up to focus on batch job used by the process (covered in a group).
Parameter Description CREATOR Use specifically for a given user, e.g. CREATOR:DDIC DATING DATING:2, the past 2 days EXECUTOR Use specifically for a given executor, e.g. EXECUTOR:DDIC The executor is the user that will execute the job-step.
JOBNAME Use specifically for a given job, e.g. JOBNAME:SAP_SLD_DATA_COLLECT or *_MC If there is a naming convention applied, like *_MC for Mission Cirtical of FIN_* for Finance department, just set the jobname with wildcards.
STATUS Use specifically for a given status, e.g. STATUS:R for active jobs The default is status A, which is cancelled jobs.
P=Planned, S=Scheduled, R=Running, F=Finished and A=Abandoned.TIMING TIMING:120, the past 2 hours
- SM37ALL Batch job overview
This sensor composes a list of the (all) batch jobs that ran somewhere in the past 45 days (alternative date can be specified). This list is used to compose a list of unique batch jobs and their steps.This sensor helps to check the overal health of the batch job administration. The sensor lists the active jobs and caters for an in-sensor registration. The sensor long text can be used to specify each specific job. Contact information (who to contact for this job) and a description (which has no max length) can be specified - information will be displayed on the overview.
The KPI on this sensor is the counter of non-registered batch jobs. This could be used to keep an eye on newly created (periodic) batch jobs.
The alternative KPI on this sensor can be set to the number of warnings that the sensor picked up. These include things like "batch jobs that have no named variant" or "batch job creator and batch job step executor are not the same person". A poor habit matter rather than show stoppers - however having a good solid clean batch job house-hold goes well with running the system properly.
A refreshing view on batch jobs
This sensor offers a refreshing view on the state of affairs with batch jobs. It reports the available jobs and steps, with periodicity information, job creator and step executioner (users). The sensor KPI indicates the number of unregistered jobs, but even without registering any jobs, the overview shows what is active (and how active) - in summarized form.
This can be used to indicate what steps could be grouped together (so several daily house-keeping steps can be captured in a single house-keeping job) or to check which regular users are running jobs under a system user (which has more authorisation). Any steps that are scheduled under multiple jobs ? With the reporting on this batch job overview, job and step matters are clarified.
Job registration
The sensor settings also cater for "job registration" of periodic jobs. A registered job is one that is mentioned in the sensor text settings, which makes it a "known job". Registered jobs can have the following details:
- Contact the person or department to contact about the batchjob (e.g. when it fails).
- Description a brief description on what the job does.
But even without specific contact or description a batch job can be registered. The idea behind this is (of course) the mechanism of keeping track of new jobs (as these are unregistered by default).
A simple solution for a rather serious problem: a clear administration on the company batch jobs is often not available or incomplete.
This information is also listed on the
SM37sensor when a job fails. Thus the person to contact can be logged on the sensorboard - which will use it as context-relevant information.Need some tools to do adjustments ? There's the
BTC_MASS_JOB_CHANGEreport. Change job creator, change step executor. Get it right.The sensor-reported content can also be composed as a list of job-steps. Instead of batch job names, the reports that are executed for the jobs are the main subject of the overview. Actual batch job information is also made available.
Parameter Description AS_WARNINGS AS_WARNINGS:Y KPI on warning messages The KPI for this sensor is defaulted to the number of batch jobs that were not registered on sensor text Settings. An alternative KPI is available as the counter of warnings.
DETAILED DETAILED:Y, show extra details NO_WARNINGS NO_WARNINGS:Y hide warning messages To simplify the reported output of the sensor, the warnings can be switched off.
STEPS STEPS:Y, reporting based on steps An alternative to reporting on individual jobs, the sensor can also be set up to report on the steps on these jobs. This can be useful when guarding step-duplication.
- Batch job creator - no longer exists
- Step executor - no longer exists
- Batch job creator is not the same as step executioner
- The variant of a step is ad-hoc (&00000000001 for example) - a bad habit
- A step / variant combination is already planned on another batch job - duplicate?
- SM37CPU Batch job continuous performance
This sensor calculates how many processing seconds were consumed by running batch jobs. It checks the batch job start and end times and calculates how much processing seconds can be claimed on the last hour. All the time combined is likely to be more than 60 minutes in the hour (as systems have multiple processors).As a stand-alone KPI count, this does not mean much. But if the sensor results are logged, it will reveal a pressure-gage graphic indicating how busy the system is. The same (nearly) information can be retrieved in standard SAP by running SM37 with a given time-slot. The SM37 report has a column on processed time which is totalled. The one thing to take into account here is that jobs that have been active for multiple hours will mess up the data. The sensor has focus on the last hour (or alternative period of time) even if the actual job already ran multiple hours.
Note that the determination logic behind this sensor is "light weight", as it simply selects logged start and en times and calculates the totals from that.
Parameter Description DATING DATING:31, the past 31 days including today PERIODIC PERIODIC:Y, only periodic batch jobs SHOWZERO SHOWZERO:Y, also show batch jobs without processing time (0 sec.) TIMING TIMING:120, the past 2 hours (default 1 hour)
- SM37LOGS Batch job logs details
This sensor checks the logs of a job for specific entries. Jobs that reveal an issue in the joblog without stopping the job, can still be monitored on a sensor.For custom developments, this means that the developer has an easy way to link his/her batchjob to a sensor. All that needs to be done is to add a message to a job log for a report when the special case to be monitored occurs. This sensor type will respond to that message.
Applicable to any message on any log. Do note that the KPI on this sensor is the number of batch jobs that contain the specified message on the batch job log. It does not count the number of times the message appears.
Parameter Description DATING DATING:31, the past 31 days including today JOBNAME Use specifically for a given job, e.g. JOBNAME:SAP_SLD_DATA_COLLECT TIMING TIMING:120, the past 2 hours (default 1 hour)
- SM37LONGEST Longest batch job
This sensor focusses on long running jobs. The simplest form will determine which of the active jobs has been active for the longest time.Long running jobs can indicate problems like dead locks or processing loops.
Parameter Description DATING DATING:31, the past 31 days including today JOBNAME Use specifically for a given job, e.g. JOBNAME:SAP_SLD_DATA_COLLECT TIMING TIMING:120, the past 2 hours (default 1 hour)
- SM37SINGLE Batch job details check
Some health checks that apply to specific batch jobs can be checked by this sensor. Expectations on the longest runtime, or the maximum time between jobs can be tested. In some cases the job should be scheduled by a system user, which can also be tested.This type of sensor is usually only applied to serious mission critical batch jobs, that need full focus attention. The general health of a job comes with expectations on how long it runs (with a minimum and/or maximum), what maximum period of time is allowed in beween runs and also who should be the batch job author.
"If it runs that long again - we need to know about it". This sensor will serve you.
Note: no need to check all these checks, just use it for the check you need, all others are optional.
Parameter Description DATING DATING:31, the past 31 days including today JOBNAME Use specifically for a given job, e.g. JOBNAME:SAP_SLD_DATA_COLLECT TIMING TIMING:120, the past 2 hours (default 1 hour)
Alternate KPI: warnings
Instead of a KPI on unregistered batch jobs, this sensor can also be utilized in another way. The Sensor shows warnings as (!) texts - which address common issues. The warnings listed:
These warnings can also be used to compose the KPI, using parameter Let this sensor help to keep the batch-job-pool in control. They are the life-line of the
system and they deserve to be monitored. There is a good reason there are 5 sensor types on the subject
of batch jobs. They (batch jobs) are important.
AS_WARNINGS or omitted
with parameter NO_WARNINGS.
Sensor: SM37
Batch jobs.
KPI: Number of batch jobs.
Sensor: SM37ALL
Batch jobs overview. Batch job step overview.
KPI: Number of unregistered jobs or the number of warnings.
Sensor: SM37CPU
Batch job performance - in minutes per hour.
KPI: Minutes of consumed processing time.
Sensor: SM37LOGS
Batch jobs with specific messages.
KPI: Number of jobs.
Sensor: SM37LONGEST
Longest running batch job.
KPI: Runtime in minutes.
Sensor: SM37SINGLE
Batch jobs detail checks, for a specific job.
KPI: Number of issues on the batch job.
Runtime errors
Any system will have problems that can't be resolved. On an SAP system these end up in the ST22 dumps overview. Dumps are the generated logs for processes that were stopped - by the system. A division by zero, a timeout on a user process that ran too long or even a programming error.
The thing with runtime errors
There are so many processes running on the system all day (and night), that some will inevitably be stopped. The system will automatically gather available information - and create a detailed logging for it: the dump. The log is a "dump of the details" for a runtime error. They can be found in transaction ST22.
So what's the concern ? There can be many, as a runtime error on a process can happen on any process. A few points of interest - on runtime errors:
- A runtime error halted a process - "in mid-air". This process thus didn't get the chance to finish it's task (and the process doesn't know about this). A runtime error is an interruption of a process.
- A common reason for runtime errors is the TIME_OUT. A user starts a report which selects so much data, that the time-out time is exceeded (something like 20 or 30 minutes). The system will stop the process and log it's details in a dump. This type of dump is usually low priority and no concern, as it does not involve updates and there is only 1 disappointed user.
- To avoid the TIME_OUT, the user could schedule the report to run in the background, to which TIME_OUT is not applicable.
- For other dialog or background processes, many things could go wrong. Sometimes even as a series of runtime-errors, which could seriously influence the system.
- Is your system using system-users for batch jobs ? This would be a very useful feature, as the jobs and the runtime-errors they may throw can easily be recognised as system-relevant (making them more important).
- Is the actual runtime-error related to an issue that has an effect on all processes ? E.g. memory related runtime errors ? When memory is running out, eventually all processes are involved. Another way to prioritize runtime errors.
- It is not uncommon for runtime errors to appear during or after transports were applied. A faulty or incomplete transport can damage coded objects leading to syntax errors.
There is only 1 sensor on runtime errors available on the sensorboard.
- ST22 Runtime errors
Checks for (new) runtime errors.This sensor works with a blacklist and a whitelist for runtime error codes. Errors that are deemed irrelevant (like TIME_OUT) can be whitelisted (will not be reported) and the errors that need attention are blacklisted giving them a higher priority. Memory-related runtime errors would be suitable candidates for the blacklist.
The sensor caters for selection refinement - to e.g. a system user.
Parameter Description EXCEPTION EXCEPTION:SYNTAX_ERROR, for a specific runtime error (EX: also works) MAXRECORDS MAXRECORDS:1000, shows additional message on historic dumps (default 10000) PRIORITY Show only high priority dumps PRIORITY:HIGH TIMING TIMING:120, the past 2 hours USER Show only for specific user USER:DDIC
Sensor: ST22
Runtime errors.
KPI: Number of recent runtime errors.
Idocs
It's becoming a bit old-fashioned, but Idocs or Intermediate Documents are a common means to interface data (documents) between systems.
The Idoc processes has 3 sensors in it's sensor-suite. One for change pointers - effectively a triggering mechanism for outbound Idocs. One for inbound Idocs and one for outbound Idocs. There is also a sensor on the space that the Idoc system consumes (SAVER_IDOCS) - see Save space save money.
- BD21 Change pointers
Checks the queue of change pointers.Change pointers can be set based on e.g. change documents, to ensure that relevant updates are sent out as outbound Idocs. It's a queue and queues should be processed. The sensor gives an insight on what is in the queue. Transaction
BD21is available on this.
Parameter Description DATING DATING:2, the past 2 days MAXCOUNT MAXCOUNT:2500 (default), the limit on the BDCP2 table, shows warning TIMING TIMING:120, the past 2 hours
- BD87INB Inbound Idocs
Checks the Idocs that are sent out from the system.The inbound Idocs, or Idocs that are presented to the system, should be processed into actual documents. Whenver this fails, the sensor will respond. Transaction BD87 shows Idoc traffic and status (for both in- and outbound Idocs).
Parameter Description DATING DATING:2, the past 2 days MSGTYP Specific to a message type, like MSGTYP:MATMAS OPTION OPTION:ALL to select all Idocs, not just faulty ones TIMING TIMING:120, the past 2 hours
- BD87OUTB Outbound Idocs
Checks the Idocs that are sent to the system.The outbound Idocs, or Idocs that are pushed out of the system, should be created when relevant (e.g. triggered by change pointers). Whenver this fails, the sensor will respond. Transaction BD87 shows Idoc traffic and status (for both in- and outbound Idocs).
Parameter Description DATING DATING:2, the past 2 days MSGTYP Specific to a message type, like MSGTYP:MATMAS OPTION OPTION:ALL to select all Idocs, not just faulty ones TIMING TIMING:120, the past 2 hours
Sensor: BD21
Change pointers.
KPI: Number of change pointers.
Sensor: BD87INB
Inbound Idocs.
KPI: Number of faulty inbound Idocs.
Sensor: BD87OUTB
Outbound Idocs.
KPI: Number of faulty outbound Idocs.
Users
The system is a servant to it's users. The sheer number of (dialog) users that are active on the system can itself become a concern. Especially when some of them run heavy reports.
The sense of how crowded the room is (was) during the day is a good indication on why
the system seems slower. Thus a logged sensor on this topic, is a nice to have you should have.
The SUIM sensor will cater for this.
- SUIM User activity
Checks the number of active users.A system is sized on the number of users. Serving users is the system's main task. One can imagine that serving 100 users or 1000 will make a huge difference in required CPU time (and memory). This Sensor keeps track on active users. When KPI logging is switched on for this sensor, a measurement on how many users the system is serving during the day is available.
Parameter Description CLASS Select only users form a group CLASS:SCC-EXTERN OPTION Select only dialog users OPTION:DIALOG
- SUIMHISTORY User history
Focus on the user ID's that have not been used for a longer period of time - which are also flagged as inactive. Users which have an end-date in the past.
Parameter Description CLASS Select only users form a group CLASS:SCC-EXTERN DATING DATING:-90, up to 90 days ago This is where you decide how long it takes for a user to become historic.
OPTION TYPE:A Select only dialog users (A,B or S)
- SUIMSLEEPERS Inactive users
Focus on the user ID's that are no longer used. This sensor identifies potential candidates that can be removed from the system - which saves licence costs.User ID's that have not been active for a longer period of time could lead to an overhead of licence costs. The inactive users or sleeping users sensor reports on the users with their last login date. Especially dialog users that have not logged on can be considered inactive.
Use the parameters to specify how many days you regard as "enough to be a sleeper", e.g. 180 or 365 days. If you know what licence costs per user apply, this sensor can be set up to report actual saving costs (use parameter
FEE:35for this - when a user licence fee is 35 euro). Parameters can also be used to focus on a user class or only dialog users.The sensor determines up to 3 dates:
- The date that user was added to the system.
- The date the last user activity was measured, on a table - this is explained below.
- The date the user last logged on.
The date the user was created will always be available, the other dates can also be blank. A background user can't log in, but a background user can temporary be a dialog used. And the activity determination does not necessarily pick up on all user activity.
Measure the last user activity
The Inactive users sensor can detect user activity by selecting the most recent create or change date on a table. The most common tables for this are the Change Document log (table
CDHDR) and the Business Application Log (tableBALHDR). Your own choice of tables can be added to this setup, through sensor longtext settings. Here's how it works:The sensor can be provided with the following info:
- Table name
- Field name for the user ID
- Field name for the date to be checked
- Optional field name for the client, if it is not called
MANDT.
The sensor will use this information to effectively perform a selection of the most recent available date on the system. Multiple tables can be added, which will make the sensor look for the most recent activity date on the combined tables. The result is a single date for the user.
Check the sensor longtext settings for details on how to add table information. This text will show the following example:
/: CDHDR/USERNAME/UDATE/MANDANT
The sensor will pick up on this and report it as settings on the sensor. What the sensor will to with this is execute the following SQL query:
SELECT username as USER, max( UDATE ) as LAST_ACTION
  from CDHDR
  group by username
Note that the fieldnames and table name are applied from the sensor text settings (CDHDR, USERNAMEandUDATE). Results will be returned like this:USER LAST_ACTION MAASDAMW 2025-03-12 MOONSY 2023-12-02 MUNSTER 2025-01-21 Sensor logic will compose these results for multiple selections and merge them into a single result holding the last action dates. Any table which holds a user name and a create or change date can be used to capture activity.
Parameter Description CLASS Select only users form a group CLASS:SCC-EXTERN DATING DATING:-90, up to 90 days ago FEE FEE:25 Monthly licence fee (euro) If you want the KPI to show what savings are applicable here, just supply the montly licence fee.
TYPE TYPE:A Select only dialog users (A,B or S)
Sensor: SUIM
Dialog users and non dialog users, user activity.
KPI: Number of active users.
Sensor: SUIMHISTORY
User history.
KPI: User accounts.
Sensor: SUIMSLEEPERS
Users that have been inactive for a longer period of time.
KPI: Number of sleeping user accounts.
Queues
Work that can't be processed immediately can be processed from a queue. So whenever the job to be done gets somewhat serious, the workload is captured in a queue and processed from there.
The system has many variations on these queues. The amount of work that is being piled up on the respective queues - can become a concern. One thing to remember here is the simple fact that the use of queues relieves the system from having to do it immediately.
- SMQ1 Outbound tRfc queue
Queue entries can be faulty or unprocessed for a long time. Both potential issues can be monitored with this sensor.
Parameter Description DATING DATING:2, the past 2 days DEST DEST:XXXCLNT300, focus on specific destination(s) NOTREADY NOTREADY:Y, focus on the errors (not status READY) QNAME QNAME:BW*, focus on specific queues RETENTION RETENTION:Y, count only expired calls This is the setting that will change the way the sensor operates. Other parameters are no longer used when this parameter is set. With
RETENTION:Ythe sensor will involve the sensor long text settings, which should hold retention periods. The KPI becomes "retired calls" and a fixer report can automatically delete them.TIMING TIMING:120, the past 2 hours
This sensor has autofix support. The sensor long text can be used to determine what the retention period for selected queues should be. Calls that are older than the retention period can automatically be deleted with report ZSENSOR_FXR_SMQ1.Download: helper class ZCL_LOG
The sensor (type) settings for the sensor are used to capture what the sensor fixer (FXR) should do. Only Entries with
AUTOFIX:Certifiedwill be processed. - SMQ1LONGEST Outbound tRfc queue
When a queue holds old information that is not processed, processing the information may no longer be relevant. This sensor focusses on the oldest queue entries.
When old entries are left unattended, there is the risk they would get reprocessed. Reprocessing old queue entries is much like going back in time. The subject of these queue entries may have been sent out again (and again) after failed message.
Parameter Description DATING DATING:2, the past 2 days QNAME QNAME:BW*, focus on specific queues
- SMQ2 Inbound tRfc queue
Queue entries can be faulty or unprocessed for a long time. Both potential issues can be monitored with this sensor.
Parameter Description DATING DATING:2, the past 2 days NOTREADY NOTREADY:Y, focus on the errors (not status READY) QNAME QNAME:BW*, focus on specific queues RETENTION RETENTION:Y, count only expired calls This is the setting that will change the way the sensor operates. Other parameters are no longer used when this parameter is set. With
RETENTION:Ythe sensor will involve the sensor long text settings, which should hold retention periods. The KPI becomes "retired calls" and a fixer report can automatically delete them.TIMING TIMING:120, the past 2 hours
This sensor has autofix support. The sensor long text can be used to determine what the retention period for selected queues should be. Calls that are older than the retention period can automatically be deleted with report ZSENSOR_FXR_SMQ2.The sensor (type) settings for the sensor are used to capture what the sensor fixer (FXR) should do. Only Entries with
AUTOFIX:Certifiedwill be processed. - SMQ2LONGEST Inbound tRfc queue
When a queue holds old information that is not processed, processing the information may no longer be relevant. This sensor focusses on the oldest queue entries.
When old entries are left unattended, there is the risk they would get reprocessed. Reprocessing old queue entries is much like going back in time. The subject of these queue entries may have changed in the mean time.
Parameter Description DATING DATING:-2, anything older than 2 days QNAME QNAME:BW*, focus on specific queues
- SM58 Rfc queue
Queue entries can be faulty or unprocessed for a long time. Both potential issues can be monitored with this sensor.
Parameter Description DATING DATING:2, the past 2 days OPTION OPTION:NOTRECORDED, focus on the errors (not status RECORDED) TIMING TIMING:120, the past 2 hours
- SM58LONGEST Rfc queue
When a queue holds old information that is not processed, processing the information may no longer be relevant. This sensor focusses on the oldest queue entries.
When old entries are left unattended, there is the risk they would get reprocessed (even by accident). Reprocessing old queue entries is much like going back in time. The subject of these queue entries may have changed in the mean time.
Parameter Description DATING DATING:2, the past 2 days
- SWEQADM Workflow event queue
Workflow events can be set up to execute immediately or via a queue. The event queue should be processed in full which can take a while when the system is busy. In addition to that the processing of an event can throw an error, which will show on the queue. This sensor keeps a close eye on the event queue.
Old events could no longer be relevant for processing. Hence this queue (like many other queues) should be kept clean and fresh. Consider deleting the old entries - once the risk of reprocessing them is too high.
Parameter Description DATING DATING:2, the past 2 days TIMING TIMING:120, the past 2 hours
Sensor: SMQ1
Outbound tRfc queue.
KPI: Number of queued messages.
Sensor: SMQ1LONGEST
Outbound tRfc oldest entry.
KPI: Age of the oldest message.
Sensor: SMQ2
Inbound tRfc queue.
KPI: Number of queued messages.
Sensor: SMQ2LONGEST
Inbound tRfc oldest entry.
KPI: Age of the oldest message.
Sensor: SM58
Rfc queue.
KPI: Number of queued calls.
Sensor: SM58LONGEST
Queue.
KPI: Age of the oldest call.
Sensor: SWEQADM
Workflow event queue.
KPI: Number of queued events.
Logs
The system is set up to keep track of what happened, for which many logging setups are available.
- SM21 System Logs
The log of all logs is the system logs. Dedicated to keeping the system up and running. Not the place where transactional data issues should be logged.
It is possible to let custom build logic drop a message on the
SM21log, but it is not recommended. theSM21log is for standard SAP matters which include logon fails, connection fails, dumps, break-point interruptions, memory issues, space issues and much much more. When a system goes down, the role ofSM21in determining the root cause is very important.Note that the sensor will only report on the error messages on
SM21.
Parameter Description TIMING TIMING:120, the past 2 hours (default 1 hour)
- SLG1 Business Application Logs
The business application log or BAL is for transactional logs. These should be made available for actual identifyable topics such as documents (an purchase order, a sales order, or even an Idoc). Business application logs are accessible through transaction
SLG1(there's alsoSLG0andSLG2) and these logs are made visible on a dedicated sensor only when they contain errors.The sensor can work with a specific object and subobject, which allows linking it to a given process. The sensor also measures the total size of BAL logging information available - with a hint on how to clear it.
I it's not only errors that need to be monitored, consider using the
SQLsensor on tableBALHDR.
Parameter Description DATING DATING:31, the past 31 days including today EXTERNAL Specific to the SLG1 external ID (EXT) (wildcards allowed) MAXCOUNT MAXCOUNT:1000000 (default), the limit on the BALHDR table, shows warning The SLG1 administration can become quite large when left unattended. Best leave the default in tact.
OBJECT Specific to the SLG1 object (OBJ) SUBOBJECT Specific to the SLG1 subobject (SUB) TIMING TIMING:120, the past 2 hours (default 1 hour)
- SCU3 Change Documents
Change Documents keep track of mostly functional documents on the system. Old and new values for a wide variety of objects are captured in Change Documents. There are sensors that keep track of the size of the tables on which Change Documents are held (
CDHDRandCDPOS). This sensor covers a different demand: it seeks out specific changes you may be interested in.The sensor long text settings can be used to specify which specific change or changes are relevant to monitor. The sensor KPI is the number of detected changes.
Parameter Description DATING DATING:10, select data for the last 2 days CHECKID CHECKID:CHECK1, for a specific check ID (sensor text settings) The sensot text administration uses a CHECKID for it's checks.
TIMING TIMING:120, the past 2 hours (default 1 hour) OBJECT OBJECT:ADRESSE, for a specific change document object class The object is the Change Document object class.
- SXI_MONITOR Processed XML messages
The XML message monitor orSXI_MONITORlogs XML traffic for the system. This setup also carries a log, for which the sensor was set up.
Parameter Description DATING DATING:31, the past 31 days including today TIMING TIMING:120, the past 2 hours (default 1 hour) USER PI_REMOTE, specifically for user
- SRT_MONI SOAP message processing
Another message monitor as transactionSRT_MONImonitors traffic to and from the system. This sensor checks whether messages could not be processed. TheSRT_MONIcan also retry errored messages, which will effect the sensor KPI.
Parameter Description DATING DATING:31, the past 31 days including today IF IF:INTERFACENAME use for specific interface (wildcards allowed) USER PI_REMOTE, specifically for user
Sensor: SM21
System log.
KPI: Serious errors.
Sensor: SLG1
Business Application Logs.
KPI: Logs with error(s).
Sensor: SCU3
Change Documents.
KPI: Detected changes.
Sensor: SXI_MONITOR
XML message log.
KPI: Number of logged messages.
Sensor: SRT_MONI
SOAP processed messages.
KPI: Number of faulty messages.
Performance
When the system performance is low, there are a number of root-causes to consider. The sensors listed here have a focus on system-wide performance. This includes CPU utilization on dialog processes and background processes, memory usage and the SM21 system log - which will reveal the first signs of system struggles.
- ST06UPTIME Last system restart
This sensor has a KPI counting the days since the last system restart. Much like the "days since last accident" signs on factory floors. A healthy system doesn't need to restart very often. The sensor shows the last date/time the system and it's database started. In addition the application servers are listed - with their respective status.
- ST06CPU CPU utilization
This sensor checks CPU utilization on the system. Processors can be idle or occupied, the over-occupied Processors will have an impact on the performance. An S/4 Hana system is equipped with multiple processors, thus the information on CPU utilization is monitored in clusters. The sensor's purpose is only to warn on excessive CPU utilization. For more detail - check out transaction ST06.
Parameter Description APPSERVER Specific to an application server APPSERVER:1 of APPSERVER:p11-paisd1_SD1_21
- ST06MEMORY Memory usage
This sensor checks Memory usage on the system. An S/4 Hana system is all in memory, but part of this is process memory used by processes (and limited). The sensor's purpose is only to warn on excessive memory usage. For more detail - check out transaction ST06.Note that memory is an application server matter, hence the calculated percentage is for all application servers combined. The sensor can also be set up to measure a single application server. Thus a sensor for each server can be set up.
Parameter Description APPSERVER Specific to an application server APPSERVER:1 of APPSERVER:p11-paisd1_SD1_21
- SM50 Work processes
The system has dialog processes and background processes which are made available. The number of processes in use versus the number of available processes is returned as percentage KPI. Dialog processes and background processes can be separated through parameter settings. Application server can also be specified.For more detail - check out transaction SM50.
Parameter Description SERVER SERVER:servername, only for application server servername TYPE TYPE:BTC, only background processes
- SM21 System Logs
The log of all logs is the system logs. Dedicated to keeping the system up and running. Not the place where transactional data issues should be logged.
It is possible to let custom build logic drop a message on the SM21 log, but it is not recommended. the SM21 log is for standard SAP matters which include logon fails, connection fails, dumps, break-point interruptions, memory issues, space issues and much much more. When a system goes down, the role of SM21 in determining the root cause is very important.
Note that the sensor will only report on the error messages on SM21.
Parameter Description TIMING TIMING:120, the past 2 hours (default 1 hour)
- SPEEDPROBE Speed probe measurement
The system is slow ! Which itself is something that can be measured. A clever speed-probe setup was cooked up for this. Here's how that works:
- Fact: the sensorboard has a heart-beat batch job that runs every few minutes (3 or 4 normally).
- This heartbeat job will execute a wide variety of sensors, each with their own selections and determinations.
- These continuous executions can be regarded as a "stable work package", which is executed all day every day.
A stable work package can be used as a fully automated system-performance-thermometer. This sensor will gather performance information from the log that is produced by the heartbeat job. The KPI for this sensor is the total number of seconds (milliseconds) that was consumed by the sensor selections/calculations.
The number of milliseconds is in fact not saying much. It only becomes information when the "score" is compared to the previous scores. Therefore this sensor works best in conjunction with the
INDEXERsensor, which will report the results as an index (much like the AEX index). You even get to choose the period of time to use for indexing.Note that this setup utilizes already consumed processing times, thus no performance is lost in the measurements itself.
Note that sensors can be slow and the "delay" can be set for slow sensors. This ensures they are not executed continuously. Sensors with a delay are automatically omitted from the performance measurements on this sensor.
Parameter Description JOBNAME Use specifically for a given job, e.g. JOBNAME:SENSOR_HEARTBEAT
Sensor: ST06UPTIME
Last system restart.
KPI: Days.
Sensor: ST06CPU
CPU utilization.
KPI: Percentage.
Sensor: ST06MEMORY
Memory usage.
KPI: Percentage.
Sensor: SM50
Work processes.
KPI: Percentage.
Sensor: SM21
System log.
KPI: Serious errors.
Sensor: SPEEDPROBE
Performance measuring - with sensor heartbeat measurements.
KPI: Milliseconds.
Workflow
Workflow processes run well if everything is set up and operational. There are background tasks that need to be scheduled, there is a queue for events that controls processing and individual work items could end in error without anyone noticing.
- SWI1 Workflow work items in error
This sensor checks for workflow work items in the Error status - which will stop the workflow. Check out transaction SWI1, SWI5 or SWI6.
Parameter Description DATING DATING:8-1, 7 days up to yesterday TIMING TIMING:120, the past 2 hours
- SWI1ACTIVE Active workflow work items
This sensor checks for active workflow work items in a normal status. These are sitting in someone's inbox waiting to be processed. Check out transaction SWI1 or SWI6.
Parameter Description DATING DATING:-30, up to 30 days ago This will focus on active workflows that have been active for more than 30 days.
- WORKFLOW Workflow operations
There is a small suite of batchjobs that should be up and running for Workflow to be operational. These jobs (or rather job steps) are checked here. This sensor reports on the batch job steps that are not executed regularly - which will affect the Workflow system.
- SWEQADM Workflow event queue
Workflow events can be set up to execute immediately or via a queue. The event queue should be processed in full which can take a while when the system is busy. In addition to that the processing of an event can throw an error, which will show on the queue. This sensor keeps a close eye on the event queue. Check out transaction SWEQADM.
Parameter Description DATING DATING:2, the past 2 days TIMING TIMING:120, the past 2 hours
Sensor: SWI1
Workflow activity.
KPI: Flow/task.
Sensor: SWI1ACTIVE
Workflow inbox of the world.
KPI: Flow/task.
Sensor: WORKFLOW
Workflow housekeeping.
KPI: Achtergrond stappen.
Sensor: SWEQADM
Workflow event queue.
KPI: Number of queued events.
Files and folders
Each application server lives on a file system, which will have a limited space for it's files and folders. So what would happen if this file-space runs out because large files are created ? The application server would be stopped. Hence the FILES sensor was made available.
- FILES Files
This sensor checks a series of file-related measurements. Settings for this are captured in the sensor long-text, which can hold details on multiple groups.
For this sensor to work, the folders that need to be checked should be set in the sensor long-text. This is done "under an ID". The ID specifies the group to be checked and the details that should be checked. The sensor can then be added to the sensorboard. If the sensor is created without ID: parameter, all checks that don't have SKIP:Y will be checked.If the sensor is used to monitor a certain process, an ID for this process can be added and the Sensor will focus only on the given ID.
For each folder several measurement points can be checked.:
- MAXFILECOUNT - for the maximum number of files that are expected in the folder
- MAXTOTALSIZE - for the maximum total filesize on the folder
- MAXFILESIZE - for the maximum allowed size of a single file
SUBDIRECTORYLEVEL - Can be used to specify the number of subdirectory levels should also be checked.
Parameter Description ID For specific ID (as specified on sensor longtext)
- ST06SPACE Server space
This sensor checks the available space on mount-locations available to the (application) server. These locations add up to a total storage capacity and all locations should have space available. The highest occupance percentage is also the sensor KPI.
Parameter Description ID For specific ID (as specified on sensor longtext)
Transaction ST06 reveals more detailed information on available space.
Sensor: FILES
Files.
KPI: Problems.
Sensor: ST06SPACE
Server space.
KPI: Percentage.
Number ranges
SAP and any other database system has dealt with number ranges since forever. Number ranges control what the next order number should be, when created through a BAPI or API or through whichever available means. Ranges have a starting point, an endpoint and a current value. When the highest value of a number range has been consumed - no new numbers will be available.
- SNRO Number ranges
The number range sensor will check all number ranges on the system. It determines which of the ranges are "getting close" to their respective high values. The KPI for this is expressed as a percentage.The sensor longtext caters for settings that can be used to ommit a number range object from the checks. And a sensor parameter can make the sensor focus on a specific number range, to make it relevant specifically for a certain process.
Parameter Description OBJECT OBJECT:FAA_AS91 for a specific object This will make the number range check specific to a number range object, e.g. for documents that are relevant for a certain department.
Transaction SNRO reveals more detailed information on number ranges.
Sensor: SNRO
Number ranges.
KPI: Percentage.
Emails
The system can compose and send out emails to notify users (or other receivers). When the system fails to deliver, the sensor can make users aware.
- SOST Outbound emails
The sensorboard relies on email itself as well. A mail notification should be sent out to the subscriber of a sensor group when one of it's sensors turns red. This sensor monitors failing outbound email messages.It is also possible to utilize this sensor on inbound emails. Set the DIRECTION:R parameter for this.
Parameter Description DATING DATING:2, the past 2 days DIRECTION Set DIRECTION:R for inbound emails MAXCOUNT MAXCOUNT:50000 (default), the limit on the SOOS table, shows warning OPTION OPTION:HISTORIC for an historic overview, longer period of time TIMING TIMING:120, the past 2 hours
Transaction SOST reveals more detailed information on sending emails.
Sensor: SOST
Outbound email.
KPI: Failed emails.
Printer output
Printer output or spools can accumulate as output from batch jobs that are not necessarily printed.
- SP01 Printer output
An overflow of spool output can become quite an issue for the system, as all processes that generate spool output will be affected. This sensor reveals the state of affairs on printer output - with errors.The PAGECOUNT parameter can be set to select larger spool outputs. E.g. PAGECOUNT:500 will also list any spools (printer output) that are larger than 500 pages.
Parameter Description DATING DATING:30, the past 30 days PAGECOUNT Selection of large spool files through page counting, PAGECOUNT:250 This will focus on larger prints.
TIMING TIMING:120, the past 2 hours
Transaction SP01 reveals more detailed information on spools.
Sensor: SP01
Printer output.
KPI: Spools.
Locks and updates
Any updates need to be locked and the actual update process (database process) can fail leaving update errors.
- SM12 Locks
The system hosts a locking mechanism that ensures our updates are protected. In extreme cases, there can be so many locks generated by some update process, that the locking mechanism itself needs attention. Are old locks released ? Is some automated process claiming too much ?
Parameter Description USER Show only for specific user USER:DDIC
Transaction SM12 reveals more detailed information on locks. - SM13 Update failures
A database update is a series of events that should lead to your changes being applied. The database should accept the changes - which is not always possible. An update error queue is available for this. Some errors can be reprocessed from the queue.
Parameter Description DATING DATING:2, the past 2 days TIMING TIMING:120, the past 2 hours USER Show only for specific user USER:DDIC
Transaction SM13 reveals more detailed information on update errors. - SM13LONGEST Oldest update failure
It is good practice to clear the SM13 queue regularly. If this is not done, there is a change that an update error is reprocessed long after it's relevance sell-by date. The update would be done on a document that may have been updated since the update error. This sensor warns about old (aged) update errors.
Transaction SM13 reveals more detailed information on update errors.
Sensor: SM12
Locks.
KPI: Locks.
Sensor: SM13
Update errors.
KPI: Update errors.
Sensor: SM13OLDEST
Oldest update error.
KPI: Days.
Housekeeping
The system relies on housekeeping actions to clean up on data that is no longer required. Old logs for batch jobs, dumps from over a month ago, Idocs which have been processed into actual documents a long time ago. It is easy to overlook these steps, as they cause no immediate harm. Until they do.
There are many cleanup jobs available as delivered by standard SAP. These sensors see to these jobs getting scheduled.
A custom setup that produces data, should also be set up to clear this data. House keeping on custom tasks can be added to these sensors.
- AIF AIF housekeeping
This sensor ensures that a set of AIF related housekeeping jobs are scheduled. Check the sensor itself for a listing of these jobs.
- SYSTEM System housekeeping
This sensor ensures that a set of general system housekeeping jobs are scheduled. Check the sensor itself for a listing of these jobs.
- CUSTOM Custom housekeeping
This sensor ensures that a set of general customer housekeeping jobs are scheduled. Check the sensor itself for a listing of these jobs.
- SAPAPO APO housekeeping
This sensor ensures that a set of SAP APO housekeeping jobs are scheduled. Check the sensor itself for a listing of these jobs.
- WORKFLOW Workflow housekeeping
This sensor ensures that a SAP's Workflow housekeeping jobs are scheduled. Check the sensor itself for a listing of these jobs.
Sensor: AIF
AIF housekeeping.
KPI: Missing steps.
Sensor: SYSTEM
System housekeeping.
KPI: Missing steps.
Sensor: CUSTOM
Custom housekeeping.
KPI: Missing steps.
Sensor: SAPAPO
APO housekeeping.
KPI: Missing steps.
Sensor: WORKFLOW
Workflow housekeeping.
KPI: Missing steps.
Self service
The sensorboard is a sub-system that itself could run unto some trouble. The board is set up to refresh every 20 seconds or so - for the end user. But the actual sensor updates are processed from a batch job, that should be up and running for the board to work. A sensor - for the sensorboard itself.
- SENSOR Self service
The self service sensor ensures the board is operational. This implies that sensor KPI values are updated regularly, but also that emails are being sent out when applicable. The sensor will gather potential problems and report on them.As the main engine behind the sensor framework is a batch job, elaborate reporting on what each available batch job is tasked with is reported on this sensor.
Note tbat this sensor is also executed when the ZEN transaction is started. Whenever this sensor errors, it is visible in the selection screen of transaction ZEN.
The sensor self-service sensor is embedded in the framework as it deserves a "special place".
There are a few settings that are applied on the sensorboard, which are customizable for the whole framework. These are:
- The background image of the sensorboard, which covers the whole sensorboard (unless dark mode is selected). (
BACKGROUND) - The location of the manuals, which is accessible from the Sensor editor (
DOCUMENTATIONandDOCUMENTATION-DETAIL) - The names of batchjobs that perform sensor-related tasks, such as board feeder jobs (job feeder: a report that is scheduled
to follow-up on the content of a sensor, so-called automatic fix jobs). (
BATCHJOBS). - As the sensor board is composed in HTML relying on CSS settings, custom settings can be added or existing settings can be
overwritten. (
CSS).
These settings are covered/explained in the sensor long text for the Self-service sensor (
SENSOR).Note that the self-service sensor also shows an overview of all available sensor types and an indication on their usage or usage count.
- The background image of the sensorboard, which covers the whole sensorboard (unless dark mode is selected). (
- SUBSCRIBE Subscribers for groups / shared inboxes
This sensor is all about subscribers. Whenever a group has sensors that can reveal an error, there should also be a subscriber that will get the notification. TheSENSORsensor type also checks this, for priority P1 groups. This sensor elaborates on subscribers, revealing all users and email addresses for the whole board.The
SUBSCRIBEsensor is also the home for shared inbox details. SAP users can subscribe and unsubscribe any group, for which the user is notified via his/her own email address (SU01D). however when shared inboxes are used, there will be no SAP user available for this. To tackle this, user idZEN_USER_01is available (and02and ...). Details on the shared inbox (name and email address) can be set up on the sensor long text and is reported on this sensor.The sensor delivers on transparency - as it produces a report which lists all sensorboard receivers with name and email address. A private address should stand out.
Parameter Description GROUP GROUP:SYSTEMHEALTH focus on specific group PRIORITY PRIORITY:P1 focus on groups with a specific priority
- INDEXER Indexer on neighbouring sensor
This sensor feeds on the logged KPI results of another sensor. With selected results, e.g. the measurements for the past month, the logged KPI measurements are gathered. The period (1 month) is split into 2 parts and the hour-by-hour day-by-day measurements are condensed into 2 average values. These values are then used to determine a growth/shrinkage percentage (like the AEX index on a company value).Meta-data sensor - which consumes the KPI results from another sensor.
SPEEDPROBEwould be a nice example for this sensor type.
Parameter Description DATING DATING:2, the past 2 days LOGID LOGID:412 The source sensor logging-ID An alternative way to determine the source sensor for indexing. A
LOGIDcan be found on the sensor in tableZSENSORS.SENSOR SENSOR:SPEEDPROBE The sensor for which indexing is required The referenced sensor can be identified with the sensor type name. If the sensor is available multiple times (in the same group), the
LOGIDcan be used to uniquely identify the source sensor.TIMING TIMING:120, the past 2 hours - ECHO Echo sister sensor - KPI checking
Sensors on the sensorboard host a warning limit and an error limit. It is generally assumed the higher the reported value, the bigger the issue. But what if values should hover in a range. Or what if the moment a KPI value breaches a value (either though increase or decrease) as KPI trigger ? UseECHO.The sensor reports on KPI fluctuations and settings - based on rules. The source sensor is the Sensor that is places to the left of the
ECHOsensor. Hence: a sister sensor.
- REMOTE Remote sensorboards
Whenever the sensorboard is used on multiple SAP systems, the "other" board can be checked through a sensor. The REMOTE sensor can be set up with an RFC (Remote Function Call) name of the target system.The sensor reports sensors in error, on the other board.
Parameter Description GROUP Focus on the sensors from a specific group (from the remote system) RFCDEST RFCDEST:SYS123 The RFC destination of the alternate system (SM59) SENSOR Focus on the sensors from a specific type (from the remote system)
- VERSION Version check
The sensorboard framework components are rolled out to multiple installations at multiple customers. With it's version management sensor, it can detect the smallest of changes on the framework components that should not be changed. Why should an open source solution not be changed ? Because changes are in the way of upgrading, as a custom change would get overwritten.Version checking is done using a hash-technique. A GUID-like hashcode is generated for the source coding of relevant components and these are embedded into the version control class (hardcoded). This hardcoded class it itself also hashed into a code, which is available centrally. Validity of this code can be checked any time.
Sensor: SENSOR
Self service.
KPI: Problems.
Sensor: SUBSCRIBE
Subscribers for groups / shared inboxes
KPI: Problems .
Sensor: INDEXER
Growth/shrinkage index of other sensor KPI results.
KPI: Percentage.3 .
Sensor: ECHO
Echo sister sensor - KPI checking.
KPI: Status (0,1 or 2) .
Sensor: REMOTE
External board.
KPI: Sensors in error.
Sensor: VERSION
Version checked.
KPI: Failed components.
Hana cockpit
The HANA Cockpit is available to monitor the systems database matters. It houses many tools that can be used
to pinpoint issues with data storage or performance. The new version of transactions DBACOCKPIT or
DB02.
Note that the Hana cockpit can be configured to send out a notification mail if something gets out of hand. The same applies to the sensors listed here - sensors that act on the same system administration that is used for the Hana cockpit. The sensorboard can thus inform you when you should look at the Hana Cockpit, for a selection of the potential issues.
- DBALERTS Alerts from the cockpit
Use transactionDBACOCKPITor HANA COCKPIT to check the Alerts. Select Current status, then Alerts.
Parameter Description LEVELS LEVELS:1,2 Only 1=Information, 2=Warning and 3 = Error
- DBMEMORY System available memory
Use transactionDBACOCKPITor HANA COCKPIT to check the available memory.
Parameter Description IN_GB IN_GB:Y In Gb (Gigabytes)
- DBSTATEMENT Expensive statements
Use transactionDBACOCKPITor HANA COCKPIT to check expensive statements. These are the sysyem top 2000 (or so) statements that consume most resources. An excellent pointer towards root cause analysis for performance issues.
Parameter Description TOP TOP:10 show the top n results (default 25) TOTAL TOTAL:Y KPI calculation on full top n results
Sensor: DBALERTS
Database administrator alerts.
KPI: Alerts.
Sensor: DBMEMORY
Percentage of available system memory.
KPI: Gb.
Sensor: DBSTATEMENTS
Most expensive statement in CPU minutes.
KPI: Minutes.
Open SQL selection
Any selection that can be executed in the SQL console of Eclipse, can also be executed in this sensor. The sensor will report on the results and determine what the KPI value should be.
As this sensor should support multiple selections, the setup caters for NAME-usage, which should alway be filled in. Thus: the NAME parameter should be set.
- SQL SQL selection
A simple selection like SELECT * FROM T000 would already be sufficient to make this sensor work. The sensor KPI would be the number of entries on T000 and the first 8 columns of this table would be listed as sensor detailed output.The sensor long text plays an important role in using this sensor. Make sure you check the explanation on the sensor long text, which is available from a button on the sensor settings. It explains all details.
This is the most versatile sensor the board holds. It can capture any selection or any result(count) that can be captured in an SQL selection. This includes JOIN or CDS view selections. Don't underestimate this sensor. It can capture the logic from several other sensors.
Example 1: minimal
As a minimalized example, a single-line selection is done on the T001 table, which holds the company codes that are set up for the system.SELECT mandt, bukrs, butxt from t001
Note that the client (mandt) needs to be specified (or set in selection) for client-dependant tables.To apply this selection to the sensor, simply create a sensor from Sensor settings. Select a group and fill in SQL for the Sensor type, press enter. If this sensor is already available, consider copying it.
The sensor text for this sensor should be edited, as per example:
	/: T001
	*  This sensor lists the T001 entries / companies.
	/: SQL
	*  SELECT mandt, bukrs, butxt from t001
To use the sensor, set it's parameter to:
NAME:T001
When the sensor is executed, the KPI will be set to the number of selected entries and the sensor content will show a table with MANDT (Client), BUKRS (Company code) and BUTXT (Company description) of all the available clients. Adjust the selection to the required client:SELECT bukrs, butxt from t001 where mandt = '120'
Note that the KPI is delivered as the number of selected records.Example 2: using a result counter
If one of the fields is named RESULT, this will be used to determine the selection KPI. To demonstrate, we will use the DBTABLOG table (always packed with data).
SELECT count( distinct tabname ) as RESULT from DBTABLOG
This selection will return a single counter which will be recognized as the sensor KPI.Another example using counters:
	select tabname, count(*) as result
      from dbtablog
      group by tabname
This will compose a KPI for the total number of records on DBTABLOG, with detailing to the counters on the table per tablename.Example 3: involve date and time
Sensors often use DATING and TIMING to limit the selection to a specified period of time. If the results should be for the past 10 days only, the SQL selection can be adjusted to:select tabname, count(*) as result from dbtablog where logdate IN DATING group by tabnameParameters on the sensor should then specify DATING, like so:
NAME:DBTABLOG-EX3;DATING:10
The sensor will apply this to the selection and report the results.The same setup can be applied as TIMING for time fields:
	select tabname, count(*) as result
      from dbtablog
	  where logdate IN DATING and logtime IN TIMING
      group by tabname
Parameters on the sensor should then specify DATING and TIMING, like so:
NAME:DBTABLOG-EX3;DATING:0;TIMING:3
Parameter Description DATING DATING:31, the past 31 days including today NAME Specify the name of the query The sensor settings for the
SQLsensor type can hold many SQL scripts and descriptions. To use one on a sensor, theNAMEmust be specified.TIMESTAMP TIMESTAMP:Y, apply DATING as a timestamp In some tables there is no actual date or time, but a timestamp is used instead. This indicator instructs the sensor to apply the
DATINGsetting as a timestamp.TIMING TIMING:120, the past 2 hours
- SQLINDX SQL indexing
This is largest sensor in coded logic. It is designed to determine a growth-index on a KPI, measured over a period of time and the same period before that time. KPI measurements from the 2 periods are compared and the growth or shrinkage are displayed as a percentage (either positive or negative). Much like the AEX-index.The versatility of this sensor is the fact that the KPI selection can be done in open SQL - so you get to decide what is being indexed. Factors at play:
- KPI calculation results are to be made available in a column named RESULT.
- The KPI can be a count, but also a value (or sum of values).
- To determine a period, there should always be a date on the selection. Option IN DATING should be used (once) on a relevant date (mostly the create date).
- Whenever the date is used (without time), the current date is not selected. This will have an effect on sensors that are refreshed all day - as these will return the same information all day.
- When in addition to a date (e.g. create date) a time is also available, the sensor will become near-real-time. The period is calculated from the current time, as reported on the sensor. This is the preferred way of using the sensor.
- Sensor parameters should include DAYS or HOURS (or both), which is a requirement on determining the selection periods.
The sensor long text plays an important role in using this sensor. Maks sure you check the explanation on the sensor long text, which is available from a button on the sensor settings. It explains all details.
Example 1: minimal
To clarify how this sensor works, let's go through an example. Table DBTABLOG holds table changes for a wide variety of changes. Let's assume this is interesting information - as it "shows system activity", which can be interpreted as "In business as usual".
An SQL selection would be required, with an outcome (KPI) on a selection that involves a date:
	  SELECT count(*) as RESULT from DBTABLOG
	    WHERE logdate IN DATING
In this example the RESULT and IN DATING segments are needed to link the selection results to the sensor. The "IN DATING" part is not standard SQL (it was cooked up by the creator of the sensorboard).The above selection can be implemented on the sensor longtext. To do this, the selection would require a name, an optional description and the SQL selection. This would look like this:
	/: TABLOG-ACTIVITY
	*  This sensor measures the number of changes logged on the DBTABLOG
	*  table, as an indication of system activity.
	/: SQL
	*  select count(*) as RESULT from DBTABLOG
	*    where logdate IN DATING
The sensor can now be set up for the above selection. Go to sensor settings, on the Sensors tab, select a group and fill in Sensor type SQLINDX, press enter. If it already exists, consider copying it. The parameters on this sensor require NAME and DAYS (or HOURS). In our example, set the sensor parameter to:NAME:TABLOG-ACTIVITY;DAYS:10
The sensor is now ready to be used. It will:- Execute the selection for LOGDATE = 10 days ago until (and including) yesterday for period T
- Execute the selection for LOGDATE = 21 days ago until 11 days ago - for period T-1
- Report on the results where T-1 and T selections are shown together
- Calculate the deviation percentage from period T-1 to T - as KPI percentage with 3 decimal positions
Example 2: involve timing
The most up-to-date index results can be determined when time is available. Applied to our example:
	  SELECT count(*) as RESULT from DBTABLOG
	    WHERE logdate IN DATING and logtime IN TIMING
This will change the selection setup quite a bit. It will involve the time in such a way that link date and time together. So when IN TIMING is used with DAYS:1 (or HOURS:24) and the current time is 13:15, it will select data from yesterday 13:15 until today 13:15.
Note that the date and time information that is used for the selections is reported on the sensor.
Example 3: add columns
In the above example, the outcome of the selection is a single counter. It is however also possible to involve other columns - elaborating on where the counter information comes from. To demonstrate this, the table name is involved. Counter results will be grouped by this table.SELECT tabname, count(*) as RESULT from DBTABLOG WHERE logdate IN DATING and logtime IN TIMING GROUP BY tabname
The effect of this will be that more information is revealed on the sensor report. To take this a bit further, let's also add the description of a TABNAME:
	SELECT log~tabname as table, DT~ddtext as description,
      count( * ) as result
      FROM dbtablog as log
       LEFT OUTER JOIN DD02T as DT on DT~tabname = log~tabname and
         DT~ddlanguage = 'N' and DT~as4local = 'A' and
         DT~as4vers = 0000
      WHERE log~logdate IN DATING and log~logtime IN TIMING
      GROUP BY log~tabname, DT~ddtext
Note: the LEFT OUTER JOIN is used, because not all table descriptions are available in English (and the slection outcome should not be influenced when a description is missing).
Parameter Description DAYS DAYS:3, period in days from yesterday HOURS HOURS:3, period in hours from last hour NAME Specify the name of the query Mandatory, as many queries can be specified on the sensor type settings.
Sensor: SQL
SQL selection.
KPI: Entries.
Sensor: SQLINDX
SQL indexing.
KPI: Percentage.
Tables
Home of data.
This sensor has focus on tables, record counts, size and growth.
- TABLES Table information
Every bit of information is held on a table. The S/4 Hana database is one that grows and grows with every minute of every day.The
TABLESsensor type keeps track of the tables of your choice. The sensor long text holds information on which table to track. The sensor produces a report of the settings and a report with the focussed tables. It calculates the number of entries and the estimated size on the database (occupied memory space, disk space is ignored here). The sensor settings can be used to specify what maximum table size is acceptable. When this maximum is breached, the sensor KPI is increased.For tables with a creation date, it is also possible to specify a maximum table growth. Specify which field is the (create) date on the table and how many days the check-period should be. The sensor will determine record counts for 2 periods (T-1 and T) and calculate the growth percentage. A growth spike can be measured on the sensor, on any (transparent) table the system uses.
To check these tables, transaction
DBACOCKPITorDB02can be used, orSE16andSE16N,SE17or the SQL console or Data preview in Eclipse.
Parameter Description OPTION Include today for deviation calculation - OPTION:TODAY TABLE For specific table name
Sensor: TABLES
Table information.
KPI: Problems.
Transports
Heart of the deployment mechanism in SAP.
This sensor reports on recent imports, with focus on errored imports.
- STMS Imported transports
The sensor that hosts functionality that can be useful on the whole landscape, when development projects are ongoing.The STMS sensor type keeps track of imported transports, whether the inport was successfull or not. The focus could be on errored transports, but the setup can also be used to "be informed" of changes becoming available.
As the sensor KPI is not necessarily indicating a problem, note the following: this sensor should only be set up with an error level - when the option
ONLY_ERRORS:Yoption is set.
Parameter Description DATING DATING:2, the past 2 days ONLY_ERRORS ONLY_ERRORS:Y, show errors only SYSTEM The target system for the transports
Inform subscribers for groups
Import of transports which is completed successfully, does not reflect an error-situation. The sensor KPI is thus in fact nothing concerning - but still good to know. If the project team is insterested in a daily overview of transport moves - the "Inform subscribers for groups" option.
Here's a step-plan on how to do this:
- Create a group, call it
TRANSPORTS(as example). - Add the sensor (or multiple sensors) to the group.
- Specify on the sensor that it should report on today's transports only (
DATING:0) or today and yesterday. Align with requirements (and make sure nothing is missed). - Schedule a
ZSENSOR_ENGINErun the moment you want to be informed. The option "Inform subscribers for groups" should be selected here.Suggested time would be in the morning so you are informed what was "moved" the day before. Make sure the option "Only KPI with value" is ticked on - to avoid emails being sent out when no transports were imported.
- Make sure the interested users are subscribed to the group.
The result is that users will receive an email in the morning, stating transports were moved the day before. When these users visit the sensorboard, the sensor(s) on the board will show a detailed overview of the transports.
In addtion the sensors can be visited ad-hoc as well, which will reveal the imports that were performed during the day - as well.
- Create a group, call it
Sensor: STMS
Transport imports.
KPI: Transports.
Save space
An S/4 Hana database is superfast because of clever architecture (column based), it caters for working with multiple processors (even within a single selection statement) and it operates from memory. Operation from memory with a backup to disk - is costly. Thus removal of data that is no longer needed, is a way to save money. These are a set of sensors that keep you informed on where table space can be saved.
These sensors target the most common standard SAP tables that hold change logs, processing logs and tables that contain information that is also applied somewhere (e.g. Idocs). This in itself holds a lot of knowledge if the system. Which tables are about change documents ? What report is available to clear aged documents ? These are all part of the sensors.
There is an overview sensor and there are detailed sensors which also have a FIXER or FXR report. A fixer report will take care of clearing old data for a retention period.
Note that the FXR reports use a class for application logging, which you may also want to implement.
Download: helper class ZCL_LOG
House keeping tasks used to be important because it would avoid poor performance. With S/4 Hana the importance
shifted to operational costs. As each system fills up with data, it is good practice to keep an eye on retired
data.
An example case: workflow. A classic workflow setup used a workflow container which held the full payload
of an XML message. The table for this workflow container contained 130Gb of data. Only 1% of these workflows
were still active. SAP hosts a report that removes old workflows, including their containers.
130Gb at 0.50 cents per Gb per month (source unconfirmed) is 65 euro per month, 780 euro per year.
Completely unused storage space.
How was this discovered ? SAP's Clean cash
Removing on to retired data - is also good for our environment
DBACOCKPIT or DB02 reveals information about the
largest tables on the system, the fastest growing tables and so much more. Go and investigate what is happening
on your system.
- SAVER_ALL Overview of space saver candidates
Todays information will age until it is no longer relevant at all. This sensor composes a list of database consumers (tables) with record counts and storage size. For each of the subjects (e.g. Change Documents, Idocs) a retention period can be defined. The sensor calculates the amount of storage Mb's that have aged, forming the sensor KPI.The
SAVE_ALLsensor should be used as an overall trigger. Add your own tables by filling in the sensor settings text. Use transaction DB02 on your system to find the top consumer tables - and decide how long the information is required.With every reported subject, the report that can be used to perform housekeeping cleanup actions is also mentioned as a hint. So to action the savings, start scheduling jobs.
Simply stop hanging on to aged data.
As this sensor relies on quite a suite of table settings to be available on the sensor long text, a lot of effort goes into finding the tables, determining suitable retention periods and also pinpointing the reports that will help clear retired data. Below you will find a .JSON file with these settings. When new candidates are found, they will be added here. All you need to do is upload this JSON file and a
MONEYSAVERgroup will be created with a sensor of typeSAVER_ALL.
Parameter Description DETAILED DETAILED:Y for extra columns (maintenance) KPI KPI:MB shows KPI as Mb TABLE For specific table name
The going price for an Mb is a fixtional 10 cents per month (adjust to what your company is paying). Every month. And not just on the production system.
- SAVER_BAL Business Application Log
Business Application Logs (transactionSLG1) hold processing logs. Not just for errors, these logs are created by numerous processes. This sensor focusses on these logs, per object. A retention period can be applied, per object. And a FIXER report is available for this sensor. Simply schedule reportZSENSOR_FIXER_SAVER_BALto automatically follow up on the AUTOFIX option on this sensor.
Parameter Description AS_PRICE AS_PRICE:Y show KPI as price DETAILED DETAILED:Y for extra columns (maintenance) MIN MIN:1000 (default) the minimal number of logs per object
This sensor has autofix support. The sensor long text can be used to determine what the retention period for selected types should be. Results that are older than the retention period can automatically be deleted with report ZSENSOR_FXR_SAVER_BAL.Download: fixer report SAVER_BAL
The sensor (type) settings for the sensor are used to capture what the sensor fixer (FXR) should do. Only Entries with
AUTOFIX:Certifiedwill be processed. - SAVER_BCS BCS Business Communication Documents
The BCS system captures documents of many types, from a variety of applications. It could hold anything from abap-produced report to Excel file to powerpoint presentation or flat data file. Usually documents that could also be available as a file. TableSOFFCONT1is the main table for size concerns.
Parameter Description AS_PRICE AS_PRICE:Y show KPI as price DETAILED DETAILED:Y for extra columns (maintenance)
This sensor has autofix support. The sensor long text can be used to determine what the retention period for selected documents should be. Results that are older than the retention period can automatically be deleted with report ZSENSOR_FXR_SAVER_BCS.Download: fixer report SAVER_BCS
The sensor (type) settings for the sensor are used to capture what the sensor fixer (FXR) should do. Only Entries with
AUTOFIX:Certifiedwill be processed. - SAVER_CD Change documents
Change documents hold change logs. These are created for numerous objects, standard SAP and custom build. This sensor focusses on these logs, per object class. A retention period can be applied, per object class. And a FIXER report is available for this sensor. Simply schedule report ZSENSOR_FIXER_SAVER_CD to automatically follow up on the AUTOFIX option on this sensor.
Parameter Description AS_PRICE AS_PRICE:Y show KPI as price DETAILED DETAILED:Y for extra columns (maintenance) MIN MIN:1000 (default) the minimal number of logs per object
This sensor has autofix support. The sensor long text can be used to determine what the retention period for selected documents should be. Results that are older than the retention period can automatically be deleted with report ZSENSOR_FXR_SAVER_CD.Download: fixer report SAVER_CD
The sensor (type) settings for the sensor are used to capture what the sensor fixer (FXR) should do. Only Entries with
AUTOFIX:Certifiedwill be processed. - SAVER_DBTLOG Table change Log
The DBTABLOG table holds change logs for tables, applied whenever the table is updated. This sensor focusses on these logs, per logged table. A retention period can be applied, per logged table. And a FIXER report is available for this sensor. Simply schedule reportZSENSOR_FIXER_SAVER_DBTLOGto automatically follow up on the AUTOFIX option on this sensor.
Parameter Description AS_PRICE AS_PRICE:Y show KPI as price DETAILED DETAILED:Y for extra columns (maintenance) MIN MIN:1000 (default) the minimal number of logs per object
This sensor has autofix support. The sensor long text can be used to determine what the retention period for selected documents should be. Results that are older than the retention period can automatically be deleted with report ZSENSOR_FXR_SAVER_DBTLOG.Download: fixer report SAVER_DBTLOG
The sensor (type) settings for the sensor are used to capture what the sensor fixer (FXR) should do. Only Entries with
AUTOFIX:Certifiedwill be processed. - SAVER_IDOC Idocs
Inbound and outbound Idocs are created and processed, after which they become disposable. This sensor focusses on Idocs, per message type. A retention period can be applied, per message type. And a FIXER report is available for this sensor. Simply schedule reportZSENSOR_FIXER_SAVER_IDOCto automatically follow up on the AUTOFIX option on this sensor.
Parameter Description AS_PRICE AS_PRICE:Y show KPI as price DETAILED DETAILED:Y for extra columns (maintenance) MIN MIN:1000 (default) the minimal number of logs per object
This sensor has autofix support. The sensor long text can be used to determine what the retention period for selected documents should be. Results that are older than the retention period can automatically be deleted with report ZSENSOR_FXR_SAVER_IDOC.Download: fixer report SAVER_IDOC
The sensor (type) settings for the sensor are used to capture what the sensor fixer (FXR) should do. Only Entries with
AUTOFIX:Certifiedwill be processed. - SAVER_SPOOL Printer output
Printed output is maintained in an elaborate setup which works with spools. It supports many types of output which could be sent to a printer, but it does not actually need to be printed. For example a batch job can produce a report a mile long, which is accessible for the job as a print spool. Print spools (transactionSP01are normally cleared from the system within weeks or a month.And a FIXER report is available for this sensor.
ZSENSOR_FIXER_SAVER_SPOOLto automatically follow up on the AUTOFIX option on this sensor.
Parameter Description AS_PRICE AS_PRICE:Y show KPI as price DETAILED DETAILED:Y for extra columns (maintenance)
- SAVER_WF Workflows
When a workflow or seingle step task completes it's processing, it becomes disposable. Workflows and their containers should never be the single source of information. The container is designed to reference existing documents and carry content that is relevant to the flow itself. As the workflow ended (status COMPLETED) it can be removed (with transaction SWWL). This sensor focusses on workflows, per workflow ID and/or single step task ID. A retention period can be applied, per workflow or task. And a FIXER report is available for this sensor. Simply schedule reportZSENSOR_FIXER_SAVER_WFto automatically follow up on the AUTOFIX option on this sensor.
Parameter Description AS_PRICE AS_PRICE:Y show KPI as price DETAILED DETAILED:Y for extra columns (maintenance)
This sensor has autofix support. The sensor long text can be used to determine what the retention period for selected workflows should be. Results that are older than the retention period can automatically be deleted with report ZSENSOR_FXR_SAVER_WF.Download: fixer report SAVER_WF
The sensor (type) settings for the sensor are used to capture what the sensor fixer (FXR) should do. Only Entries with
AUTOFIX:Certifiedwill be processed.
Sensor: SAVER_ALL
Overview of space saver candidates
KPI: Euro or Mb
Sensor: SAVER_BAL
Business application log data
KPI: Mb or Euro.
Sensor: SAVER_BCS
Business communication documents
KPI: Mb or Euro.
Sensor: SAVER_CD
Change document data
KPI: Mb or Euro.
Sensor: SAVER_DBTLOG
Table logging data
KPI: Mb or Euro.
Sensor: SAVER_IDOC
Idoc data
KPI: Mb or Euro.
Sensor: SAVER_SPOOL
Print output
KPI: Mb or Euro.
Sensor: SAVER_WF
Workflow data
KPI: Mb or Euro.
Sensor controls
Sensors are very customizable creatures. It's behaviour can be customized to respond with a warning or an error (general settings). But it can also be set up to just report on KPI's without further action. In addition to that, sensors can be fine-tuned with settings that are relevant to only that sensor.
Sensors can be fine-tuned to respective requirements. This is done through sensor parameters of which there are 2 types:
- The sensor parameter, a series of control settings
- The sensor long text, a much more elaborate set of settings, available as a text.
Warning level
Make the sensor go yellow when a certain KPI is reached.
Error level
Make the sensor go red when a certain KPI is reached.
... and inform subscribers.
Controls
Control settings that are specific to the sensor type.
General settings
Settings that can be applicable to any sensor are called general sensor settings.
None of the general settings are mandatory, as defaults are available. It is however possible and even recommended to personalize sensors to what they do. Feel free to supply a new name to the "Dumps" sensor if they are about the dumps for today only. "Todays dumps" would be a suitable title.
The general settings include details like
- Title and UoM - these will appear as texts on the sensor tile and sensor full description.
- Warning and errorlevel - these will determine the sensor behaviour. The status of the sensor is determined with warning level and/or error levels.
- Delay - this controls how often the sensor should be checked. As it's pointless to have a sensor about yesterdays data redetermine the same results all day.
- Sequence - determines where the sensor is shown within the group.
- Documentation link - this will present a documentation link on the sensor tile and sensor detail overviews.
- Logging - controls the logging options. Makes sense for some sensors, makes no sense on others.
- Detailed - indicates whether the sensor detailed logging should be performed. This is a 2-step process, first the sensor needs to be flagged as "Detailed" and then the sensor engine report needs to be scheduled to actually capture these details. Thus the frequency is a arranged in the scheduled batch job (or jobs).
General settings - are specific to the sensor
General settings are called as such, because they are the same settings that can be applied to each and every sensor. They are very specific to the sensor though. Just like the sensor parameters (next paragraph) and unlike the sensor long text settings (which apply to all sensors with the same sensor type).
The sensor general settings form the general controls over (all) sensors. They may seem "picked at random" but they all serve a purpose. Take Delay for example. When a sensor consumes a lot of time (anything over 4 seconds), you should consider setting the delay. Effect ? The sensor is not executed every time - which adds up to a lot of processing time at the end of the day. Just so you realize: each setting has it's own story.
General settings
Applicable to all individual sensors.
Not always mandatory for a sensor.
Specific to a sensor type.
White versus Colored
Its the sensor warning and/or error limits that determine whether a sensor is white or colored (green/yellow/red).
White sensors have no warning or error limit.
Sensor parameters
The sensor parameter is a short 1-liner that consists of upper-cased instructions for the sensor. A common example would be
DATING:10Which instructs the sensor to select data from the past 10 days. Sensors can be added to a group on the board without limits - however there is one limit: the parameter settings for a sensor should be unique within a group. Thus no 2 sensors can deliver the same information in the same group. Makes sense when you think about it.
Feel free to compose a new group with the best of relevant sensors from other groups.
To find out what parameters are available on the sensor you want to use, simply use the F4 function on the
parameters field (which lives on the Sensor settings editor). Only (and all) relevant parameters will be listed
here.
Sensor variations
As a sensor can often be controlled with a parameter, a variation on your sensor can be introduced by simply copying
a sensor with alternate parameter settings. A common example would be date-ranges. The sensor that is reporting
on information from today (DATING:0), can also be set up to report on yesterday (DATING:1-1). And a third sensor
could report on the week before (DATING:8-2) that.
The TIMING parameter
Some of the parameters require a bit more detailed explanation. TheTIMING and DATING parameters are available for date-specific
sensors. As we're not too interested in yesterday's news, these parameters allow you to control the time-frame in
which the sensor should operate. When these parameters are not specified, the system will assume a sensible default.
Usually, there is only one of DATING and TIMING specified. An example:
TIMING:180This means nothing older than 3 hours is selected.
TIMING:180-5This means nothing older than 3 hours is selected and the last (most recent) 5 minutes are also not selected.
The DATING parameter
For dating, the same formatting is used. There is however - this thing called "today". The most common examples
of DATING:
DATING:1This means yesterday and today. The current day is almost always included in the selection.
For only yesterday (and not today) use this:
DATING:1-1
For older than 2 weeks, but not older than 6 weeks use this:
DATING:45-14And if it's only today then use This
DATING:0If a sensor throws errors on an item that can age, then simply fill in the
DATING parameter with the
number of days you want to look back. E.g. DATING:30. And add a backup sensor with parameter value
DATING:120-30 for the old cases (90 days).
The DATING can also be used to select dates older that a given date. Some sensors work with
a retention period, for which the following setup can be used:
DATING:-90
Specifies a date as 90 days or older.
Find sensor parameters
Use the F4 function on the parameters field on the sensor (first focus on the sensor in the settings editor).
This will show the possible parameters that can be used for the sensor (differs for each sensor type).
Parameter
Makes the sensor unique within it's group.
TIMING
Involve the time, by looking back a number of minutes
DATING
Involve the date, by looking back a number of days
Sensor long text
The sensor long text holds sensor settings that are applicable to all sensors of the same type. There is no limit to the settings, lower cased values are supported and there is usually a mechanism like ID or NAME in place to link the settings to a specific sensor from the board. The ID or NAME would need to be specified on the sensor parameters.
The documentation on the sensor long text is available only for sensors that use the long text. A documentation button is shown in the Sensor settings editor.
Note that this documentation is available only in English. And for those who will add their own sensors to the framework: the sensor long text documentation is derived from comments in your coding. Make sure you also add such comments - to serve our end users.
Here's how that looks:
        "Fetch longtext information, for lt_whitelist (to be skipped) and lt_blacklisted (marked as high importance)
        DATA(lt_textlines) = zcl_sensor_manager=>get_longtext( ).
*| The sensor text can be used to specify which runtime errors can be ignored
*| (whitelist) and which ones are super important (blacklist). Memory-related
*| dumps have already been blacklisted for you (embedded in the coding of the
*| sensor). For additional settings:
*| /: BLACKLIST
*| *  TSV_TNEW_BLOCKS_NO_ROLL_MEMORY
*| *  SYNTAX_ERROR
*| /: WHITELIST
*| *  TIME_OUT
*| *  RAISE_EXCEPTION
        LOOP AT lt_textlines INTO DATA(lv_textline).
The (prehistoric) long text editor
The sensor type long text utilizesSO10 texts in the English language. As the actual contents of the settings
is up to the sensor type logic, the sensor long text is the standard for these settings. Each text line is preceded with
a line type, which is either /: or * . The /: for upper-cased values, everything
else for regular text.
Sensor settings ?
No.
This is for sensor type settings. Thus all sensors with the same type can use these (same) settings.
Versions
A product like the sensorboard is never completely finished and finalized. New sensors are created regularly at the customer site. Some of these sensors may me applicable for other customers as well, thus new sensors (sensor type logic) can be added to the suite over time.
The board itself may also be improved. As we are working with customer requirements, there may be requirements that can be useful for other customers too.
This overview is the version or release blog, briefly explaining what was added/changed with the release. When this page is called directly from the sensorboard (click on version number), a version-check is done.
Two ways to do the check:
- Click on the "Version ... " at the left side of the sensorboard main overview.
- Set up a sensor with sensor type
VERSIONwhich reports on anomalies. The sensor also hosts a link to check the overall board.
Version check
A version number was passed, which is now checked to determine which current version is being used.The check code that was passed is "3017F8AE1448D2AF6CBD313016AAA3B4ED42B30E", which is also displayed on the VERSION sensor.
The check code was incorrect.
What does this mean ?
If the check was done directly from the sensorboard (SAPGUI, transaction ZEN) then the coding of the sensorboard framework has been changed (is no longer original). There may be good reason for the changes, but an upgrade will overwrite custom changes.
The self-service sensor from the board will report this and the actual altered component is listed on the sensor.
Version overview
| Version | Added features |
|---|---|
| 2025-?? |
|
| 2025-08 |
|
| 2025-06 |
|
| 2025-01 | As preperation for the first main go-live with the sensorboard - lots of effort was put into delivering a good solid product.
|
| 2024-11 | After full design and development rounds, the framework was applied to a new system where it
was demonstrated to the customer. Installation time under 2 hours.
First version-managed release. |
We're on 2025-08
The latest version we have available now.
(Released on 29.08.2025).
From version 750
Of S/4 Hana
SAP_BASIS 750 SAP_ABA 750 SAP_UI 754